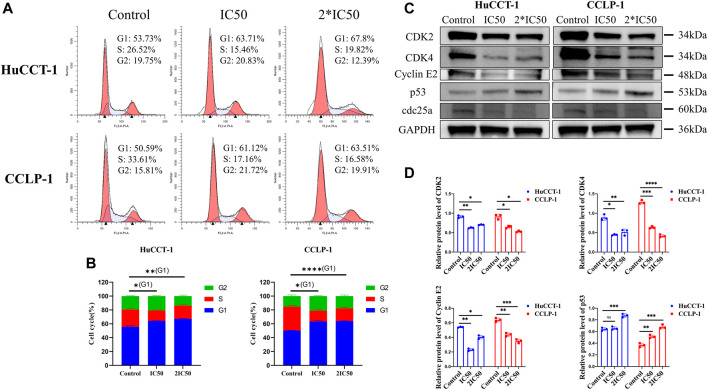
FIGURE 3.
Silibinin induced G1 arrest in cholangiocarcinoma. (A,B). Cholangiocarcinoma cell cycle distribution was determined using FCM analysis after treatment with IC50 and 2*IC50 concentrations of silibinin. The histograms show the percentage of HuCCT-1 and CCLP-1 cells in each phase. (C,D). Western blotting results of G1 checkpoint proteins. Cells were treated with IC50 and 2*IC50 concentrations of silibinin for 48 h. The quantification results of CDK2, CDK4, Cyclin E2 and p53 are demonstrated by histograms. Data are shown as mean ± SD, *p < 0.05, **p < 0.01, ***p < 0.001, ****p < 0.0001, significantly difference compared with control group.

