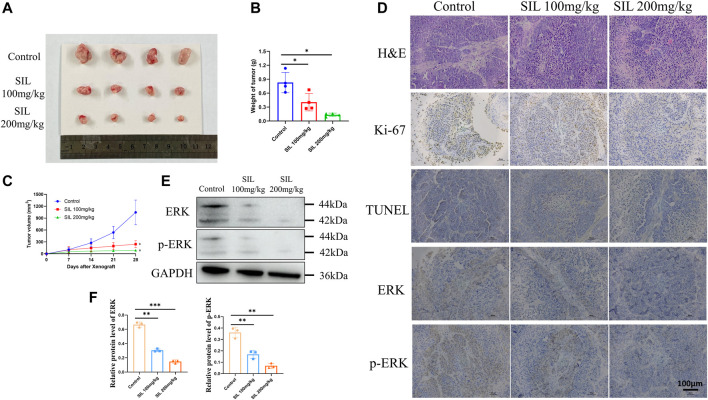
FIGURE 7.
Silibinin suppressed tumor growth in the cholangiocarcinoma xenograft model. (A). Anti-tumor activity of silibinin in tumor-bearing mice. Representative xenografts are shown. (B). Tumor weights of each group measured at the end of treatment. Data are shown as mean ± SD, *p < 0.05, significantly different compared to the control group. (C). Tumor volumes of each group are measured in the indicated days of treatment. *p < 0.05 meant a significant difference compared to the control group at the end of the treatment. (D). H&E, Ki-67 and immunohistochemistry assays of cholangiocarcinoma tissue. (E,F). The expression of ERK and p-ERK proteins was detected in vivo, and quantification results are shown by histograms. Data is shown as mean ± SD, **p < 0.01, ***p < 0.001, significantly different compared to the control group.

