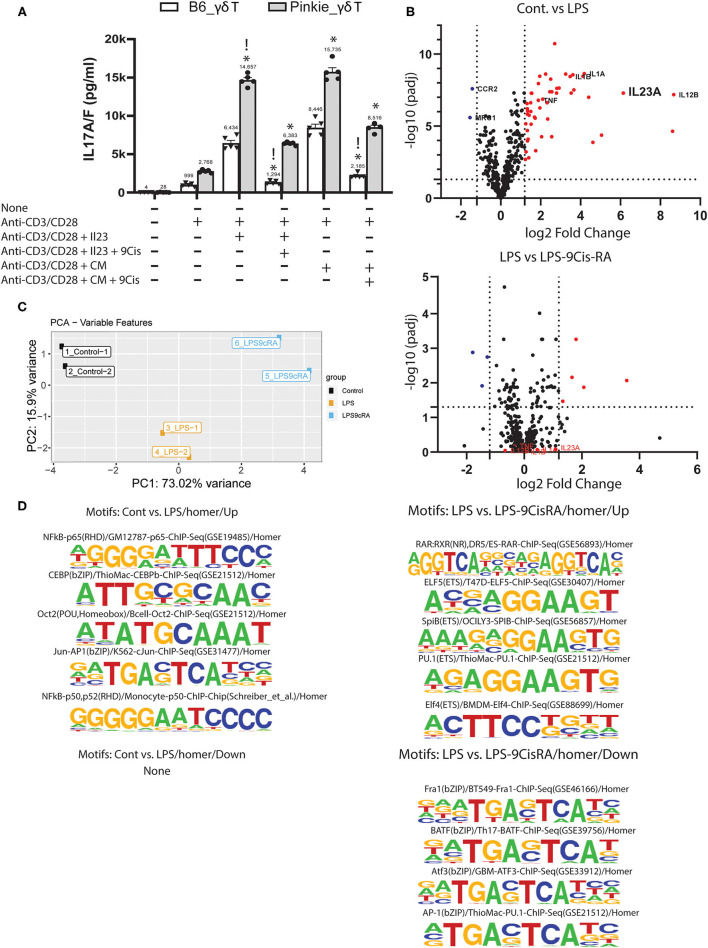
Figure 4.
Suppressive effects of 9-cis retinoic acid. (A) IL-17A/F concentration in supernatants of cultured γδ T cells isolated with magnetic beads from C57BL/6 or Pinkie spleens. Cells are stimulated with anti-CD3/CD28 beads or beads plus recombinant IL-23 without or with addition of 100 μM 9-cis retinoic acid (RA). IL-17A/F is measured by ELISA. !p < 0.05 between treatment groups, *p < 0.05 between B6 and Pinkie strains. (B) Volcano plots showing the expression level of genes in monocytes cultured in media alone, media plus LPS or media plus LPS and 100 nM 9-cis RA. A mouse myeloid Innate Immunity NanoString array was used to evaluate gene expression. Dotted vertical lines indicate < or >1.5 log2 fold change and horizontal lines indicate genes with an adjusted p > 0.05. Red dots are genes that are significantly increased by LPS (top) or by LPS + 9-cis RA (bottom). γδ T inducers (TNF-a, IL-1a, IL-1b, and IL-23a) are stimulated by LPS and reduced by 9-cis RA. (C) ATAC seq: principal component analysis of peak sequences identified by ATAC seq in 3 experimental groups of cultured murine monocytes: control, cells stimulated with LPS and cells stimulated with LPS and 100 nM 9-cis RA (n = 2/group). (D) Sequence logos of transcription factor binding motifs that are found to be increased (up) or decreased (down) in the second group compared to the first group (top 4–5 motifs are shown for each group, except control vs. LPS where no decrease in motifs are found). Motifs are identified by the HOMER peak caller from databases of known motif sequences (20).

