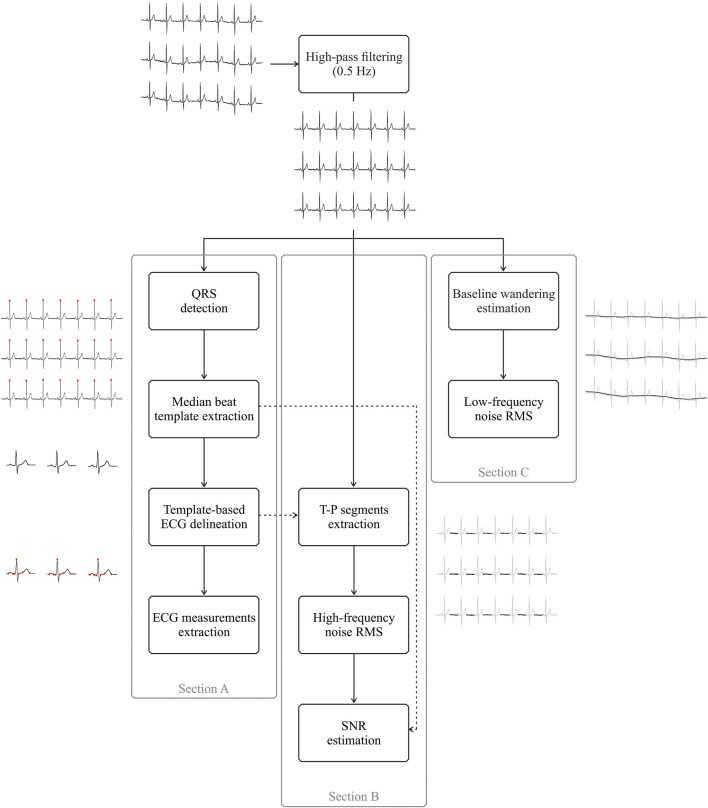
FIGURE 3.
Schematic representation of the different signal processing steps adopted for ECG measurement extraction (Section A) and for signal-to-noise ratio (SNR), high-frequency and low-frequency noise root-mean square estimation (Sections B and C, respectively). All sections share the same initial processing step, i.e., high-pass filtering at 0.5 Hz, despite the different purposes. Furthermore, the dashed arrow pointing from the template-based ECG delineation (Section A) to T−P segments extraction (Section B) indicates that T−P intervals were identified in high-pass filtered ECGs by exploiting T and P wave delineation on median beat templates, whereas the dashed arrow pointing from the median beat template extraction (Section A) to SNR estimation (Section B) refers to the adoption of the peak-to-peak amplitude of the median beat template for the SNR computation.

