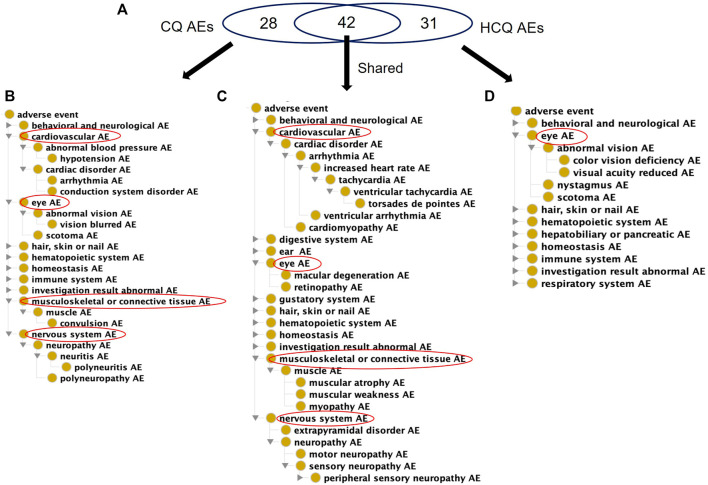
FIGURE 2.
Comparison of USPI-listed AEs associated with chloroquine and Hydroxychloroquine using the OAE. (A) Venn Diagram of CQ and HCQ AEs. (B) OAE display of 28 CQ-specific AEs (C) OAE display of 42 AEs shared by CQ and HCQ. (D) OAE display of 31 AEs specific to HCQ. These results were identified using the FDA US Prescribing Information (USPI) data. In each panel in (B,D), cardiovascular and eye AEs are expanded, if present in the list. Overall CQ and HCQ were associated with similar AE profiles, but HCQ had fewer types of severe cardiovascular, nervous, and musculoskeletal AEs.

