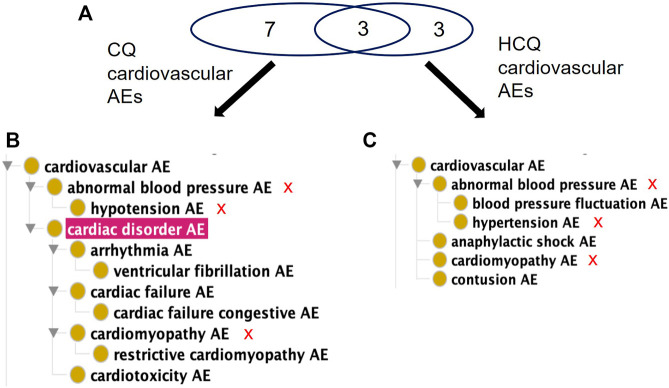
FIGURE 3.
Comparison of significant cardiovascular AEs for CQ and HCQ from the FAERS database. (A) Venn Diagram of significant cardiovascular AEs for CQ and HCQ. (B) OAE classification of 10 significant cardiovascular AEs for CQ. (C) OAE classification of 6 significant cardiovascular AEs for HCQ. The red sign of “X” next to the AE terms in (B,C) represent the shared AE for CQ and HCQ. Note that cardiac disorder AE passed the significance threshold for CQ (A) but not for HCQ (B). Overall CQ was associated with more cardiovascular AEs.

