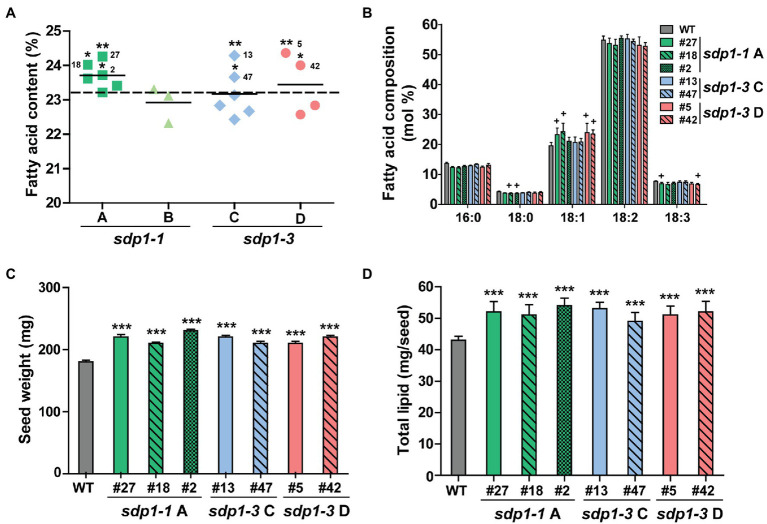
Figure 4.
Transgenic lines targeting GmSDP1 expression possess seeds with increased high fatty acid content. (A) Scatter plot showing the fatty acid content of seeds containing different constructs targeting SDP1 expression. Each data point corresponds to an independent transgenic line and represents the mean fatty acid content as a % of dry seed weight of T3 seeds from two plants for each line. Solid horizontal lines represent the average fatty acid content for each construct. The horizontal dashed line indicates the mean fatty acid content of seeds harvested from two control wild-type plants. Numbers denote the specific lines chosen for further compositional analysis. Statistically significant differences between wild-type and transgenic lines were determined using Student’s t-test; **, p < 0.05; *, p < 0.3. (B) Mean fatty acid composition of T3 seed harvested from two plants each for select transgenic lines. Error bars represent SD. Crosses indicate significant differences with wild-type seed (+, p ≤ 0.001; Student’s t-test). (C) Average seed weight. Values represent the mean ± SD of 45 seeds collected from two plants for each line. ***, p < 0.001 based on a two-tailed t-test. (D) Seed fatty acid content calculated on a per seed basis. Values represented the mean ± SD. ***, p < 0.001 based on a two-tailed t-test.

