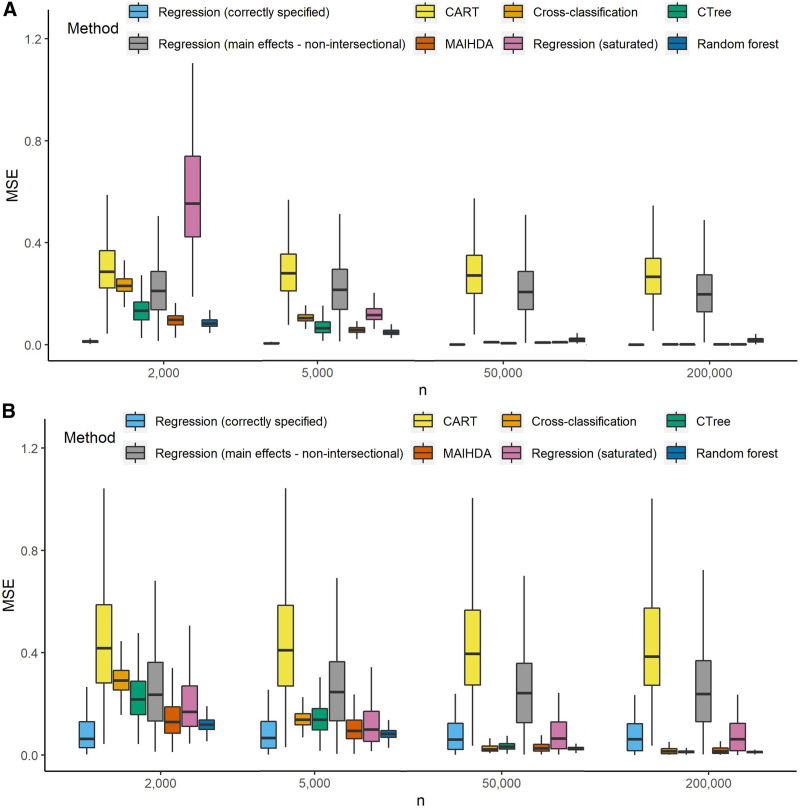
FIGURE 1.
A,B, Boxplots of the MSE of intersection estimations for four different sample sizes (graph excludes outliers): (A) Categorical inputs and (B) Mixed inputs. Methods include three single-level regression models, the MAIHDA, cross-classification, and three tree-based methods: CART, CTree, and random forest. CART, classification and regression trees; CTree, conditional inference trees; MAIHDA, multilevel analysis of individual heterogeneity and discriminatory accuracy; MSE, mean squared error.

