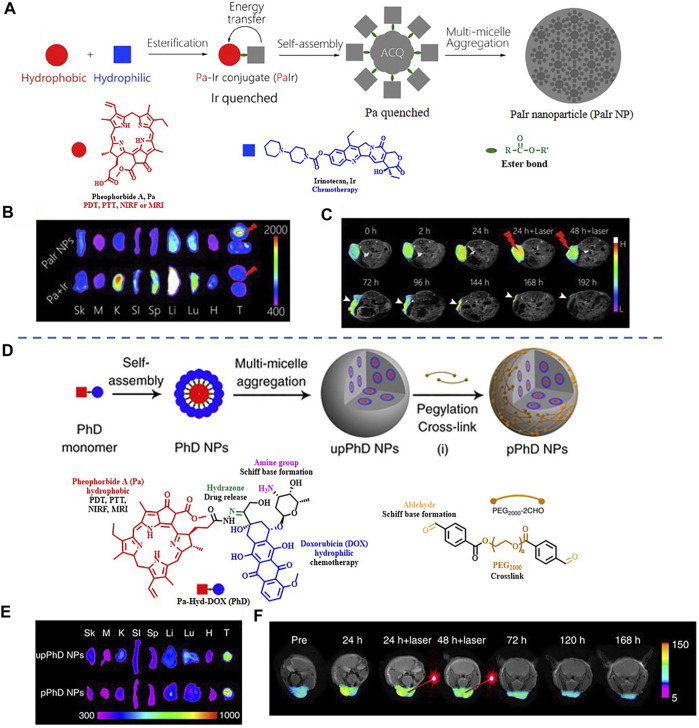
FIGURE 9.
(A) The fabrication of PaIr NPs. (B) Ex vivo distribution of PaIr NPs indicated by intrinsic NIRF. (C) Self-indication of the phototherapeutic effect by T 1-weighted MRI. Reproduced with permission from Xue et al. (2018b). Copyright 2018, Elsevier. (D) Schematic illustration of the fabrication of pPhD NPs. (E) Ex vivo distribution of pPhD NPs indicated by intrinsic NIRF. (F) Phototherapeutic effect monitored by MRI. Reproduced with permission from Xue et al. (2018a). Copyright 2018, Nature.

