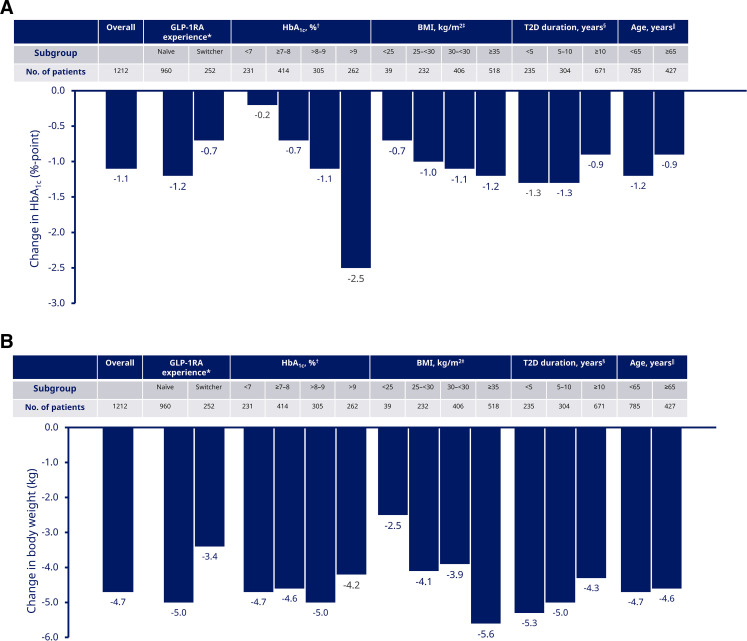
Figure 1.
(A) Change in HbA1c from baseline to EOS in overall population and subgroups; (B) change in body weight from baseline to EOS in overall population and subgroups. Data are from the full analysis set, in-study period that represents the time period during which patients are considered to be in the study, regardless of semaglutide treatment status. Response was analyzed using baseline T2D duration, age, BMI, time, time-squared, preinitiation use of DPP-4i, preinitiation use of insulin, preinitiation use of GLP-1RAs, GLP-1RA (except in ‘GLP-1RA experience’ subgroups), number of OADs used preinitiation (0–1/2+) and sex with random intercept and random time coefficient (slope). (A) All p values for change from baseline to week 30 are significant at <0.0001. Interaction p value for difference in change between subgroups: *p=0.0003; †0.0209; ‡0.9354; ‖0.1944; §0.3504. (B) All p values for change from baseline to week 30 are significant at <0.0001 except p=0.0092 for baseline BMI of 25 kg/m2. Interaction p value for difference in change between subgroups: *p<0.0001; †0.8730; ‡0.5791; §0.8419; ‖0.7569. BMI, body mass index; DPP-4i, dipeptidyl peptidase-4 inhibitor; EOS, end of study; GLP-1RA, glucagon-like peptide-1 receptor agonist; HbA1c, glycated hemoglobin; OAD, oral antihyperglycemic drug; T2D, type 2 diabetes.

