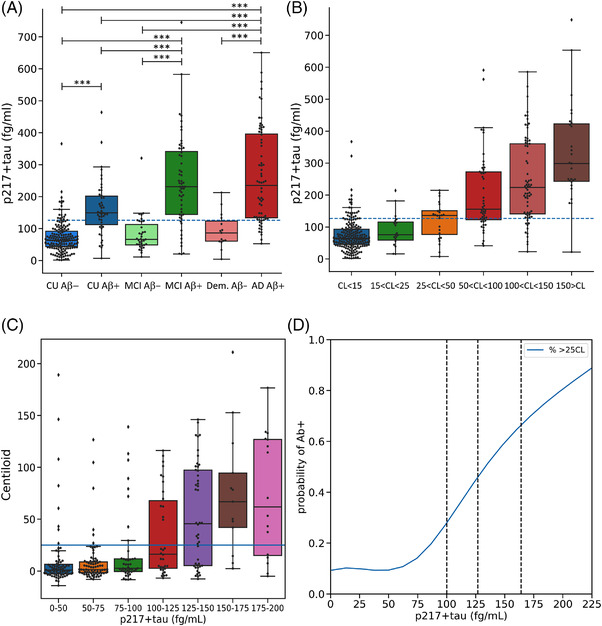
FIGURE 1.

Plasma p217+tau concentrations between (A) clinical classification and amyloid beta (Aβ) PET status and (B) Centiloid (CL) levels of Aβ. The dashed line corresponds to the threshold derived by the Youden index. (C) CL results versus p217+tau level in 25 fg/mL intervals, (D) probability of being Aβ PET positive versus p217+tau level. Vertical lines in (D) are Youden index derived from cognitively unimpaired (CU) (100.3 fg/mL), Youden index derived from total cohort (126.7 fg/mL) and +2.0 SD of the Aβ‐ CU (164 fg/mL). *** P value < 0.0005
