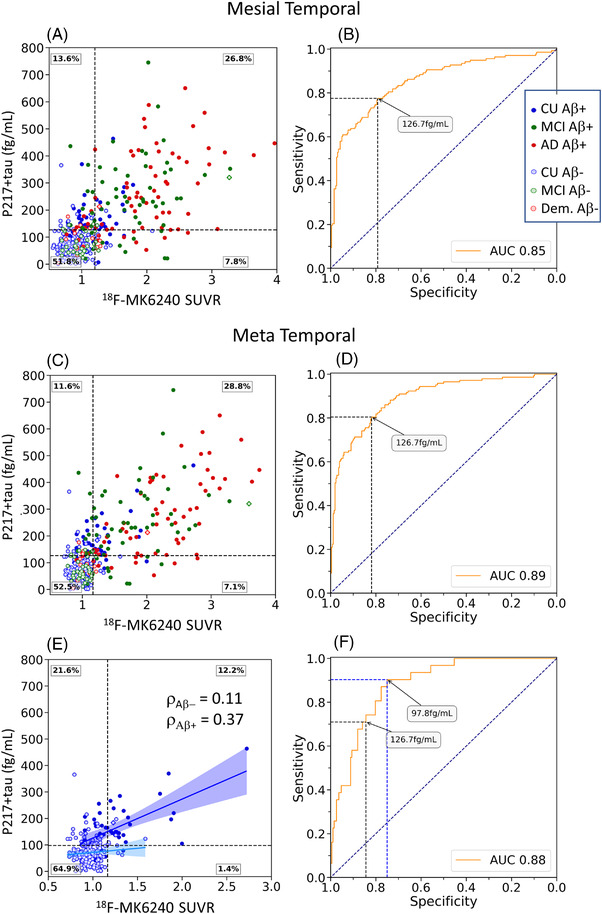
FIGURE 4.

Plasma p217+tau versus PET SUVR measures of tau. Scatter plot and ROC curve for mesial temporal regions of interest (ROI) (A & B) and meta temporal ROI (C & D) and in cognitively unimpaired (CU) alone (E & F). Clinical groups are color‐coded with red for dementia, green for mild cognitive impairment (MCI), and blue for CU. Solid circles are Aβ PET positive. The black dashed horizontal line corresponds to the p217+tau threshold derived from the Youden index. Linear correlation and Spearman co‐efficient are shown for the Aβ+ (dark blue) and Aβ− CU (light blue) in part E
