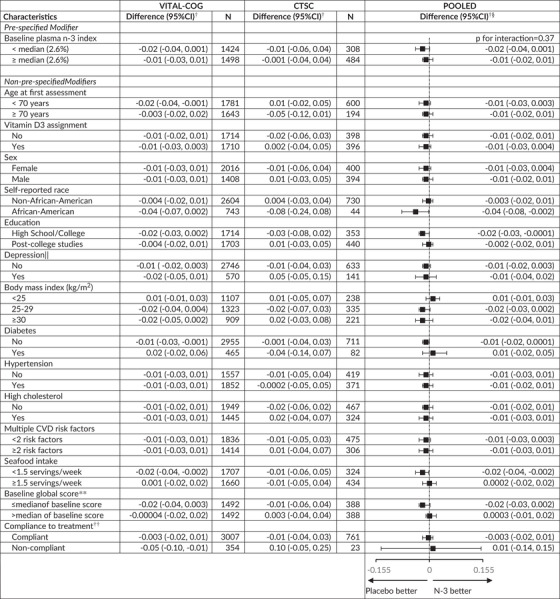
TABLE 5.
Mean difference (95% CI) in rate of change in global score* between the N‐3 and placebo groups: Effect modification by risk factors for cognitive decline

|
Abbreviations: CI, confidence interval; CTSC‐Cog, subset that received in‐person interviews at the Harvard Clinical and Translational Science Center for VITAL in Boston, MA; CVD, cardiovascular disease; VITAL‐Cog, subset that received telephone cognitive interviews in VITAL.
For definitions of the global scores for the two populations, see footnote for Table 2.
Mean difference in annual rate of decline of n‐3 – placebo groups from multivariable‐adjusted linear mixed models: see footnotes for Tables 2 and 3. The stratified analyses were done among those with non‐missing data on the effect modifier.
None of the interaction terms were significant at the Bonferroni‐corrected significance threshold of P = .0036 (= 0.05/14 other modifiers): p‐interaction≥0.04
Stratum‐specific estimates and interaction terms were pooled using Dersimonian and Laird fixed‐effects method for meta‐analysis 32 except for where the P for heterogeneity across the two substudies for the interaction term for age was < 0.05 (P = .03) and results were meta‐analyzed with random‐effects.
See footnote in Table 1 for definition of depression.
Median for the global score was 0.05 in both the VITAL‐Cog and the CTSC‐Cog.
Compliance is defined as self‐reported taking of ≥two‐thirds of pills on all the follow‐up questionnaires between the first and the second cognitive assessment and not initiating out‐of‐study fish oil supplementation.
