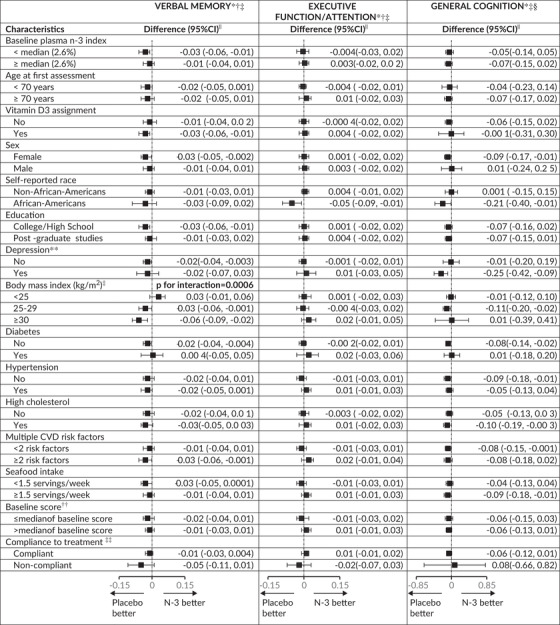
TABLE 6.
Pooled* results across VITAL‐Cog and CTSC‐Cog for mean difference in annual rate for the secondary outcomes for N3 group versus placebo group: Effect modification by risk factors for cognitive decline

| |||
Abbreviations: 3MS, Modified Mini‐Mental State Examination; CI, confidence interval; CTSC‐Cog, subset that received in‐person interviews at the Harvard Clinical and Translational Science Center for VITAL in Boston, MA; CVD, cardiovascular disease; TICS, Telephone Interview of Cognitive Status; VITAL‐Cog, subset that received telephone interviews in VITAL.
Stratum‐specific estimates and interaction terms were pooled using Dersimonian and Laird fixed‐effects method for meta‐analysis 32 except for where the P for heterogeneity across the two substudies was < 0.05; for these, the results were meta‐analyzed with random‐effects.
For definitions of the verbal memory and executive function scores for the two populations, see footnotes for Tables 2.
For these secondary analyses, none of the tests of the pooled interaction terms were significant at the Bonferroni‐corrected significance threshold of P = .0011 (= 0.05/45 [3 outcomes, 15 modifiers[; raw p for interactions≥0.05) except for the interaction by body mass index for verbal memory score: P for interaction = 0.0006.
Due to the differences in scale between the TICS (0–41) and 3MS (range 0–100), for pooling purposes, the 3MS scores were multiplied by 0.41 for conversion to the same scale as the TICS scores.
From multivariable‐adjusted linear mixed models of cognitive performance: multivariable‐adjusted analysis with adjustment for vitamin D3 assignment (yes/no), sex (male/female), age at randomization (years), race/ethnicity (non‐Hispanic White, Black, other), education (high school or under, college, graduate school), history of depression (yes/no), except when a particular factor was being used for stratified analyses or tested for interaction.
For the definition of depression, see footnote in Table 1.
For the verbal memory score, the median was –0.02 standard units in VITAL‐Cog and 0.02 in the CTSC‐Cog; for the executive memory/attention score, the median was 0.04 in VITAL‐Cog and 0.02 in the CTSC‐Cog; for TICS, the median was 34 in VITAL‐Cog and for the 3MS in CTSC‐Cog, the median was 96 (equivalent to 39 on the transformed variable to have the same range as the TICS).
Compliance is defined as self‐reported taking of ≥two‐thirds of pills on all the follow‐up questionnaires between the first and the second cognitive assessment and not initiating out‐of‐study fish oil supplementation.
