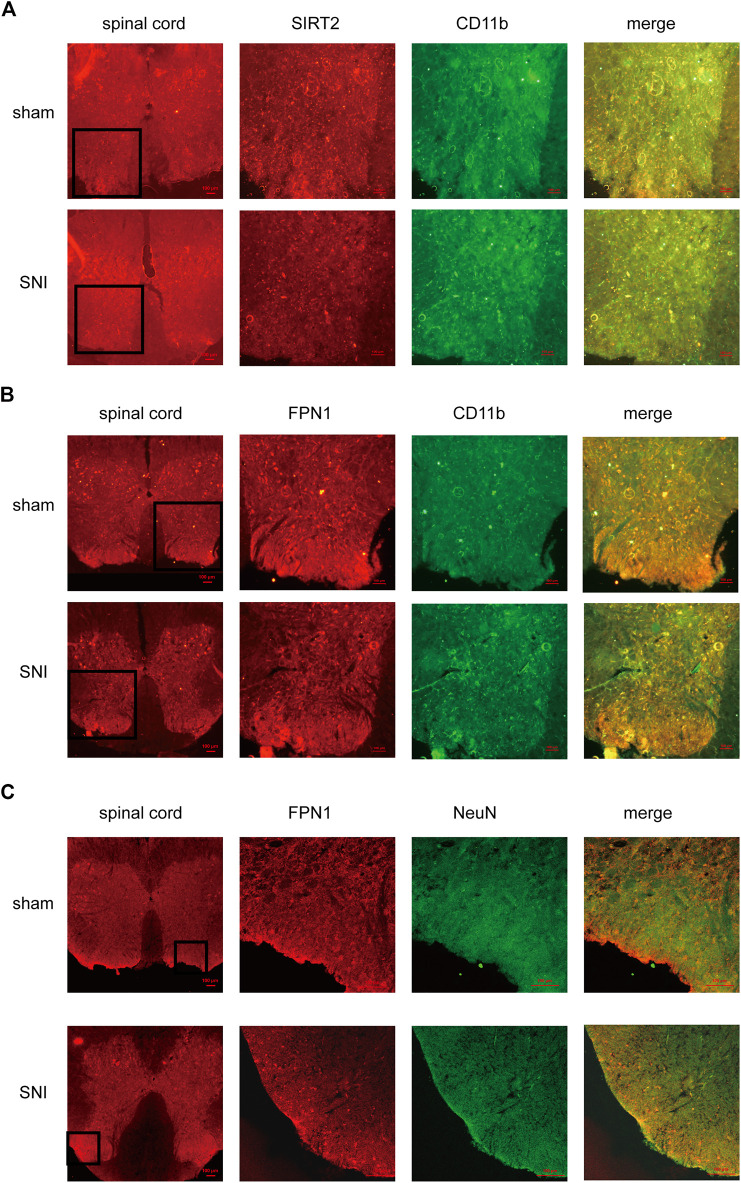
FIGURE 3.
The cellular localization of SIRT2 and FPN1 in the spinal cord. (A) SIRT2 levels decreased in the microglia of SNI rats. (B,C) FPN1 levels decreased in the microglia and neurons of SNI rats. The image in the first column on the left shows the overall outline of the spinal cord. Representative confocal images show the results of double immunofluorescence staining of SIRT2 or FPN1 (red) in the spinal dorsal horn; CD11b, a microglia marker (green) or NeuN, a neuronal marker (green) in the sham group and SNI group. Scale bars, 100 μm. SNI, spared nerve injury; SIRT2, sirtuin 2; FPN1, ferroportin 1.

