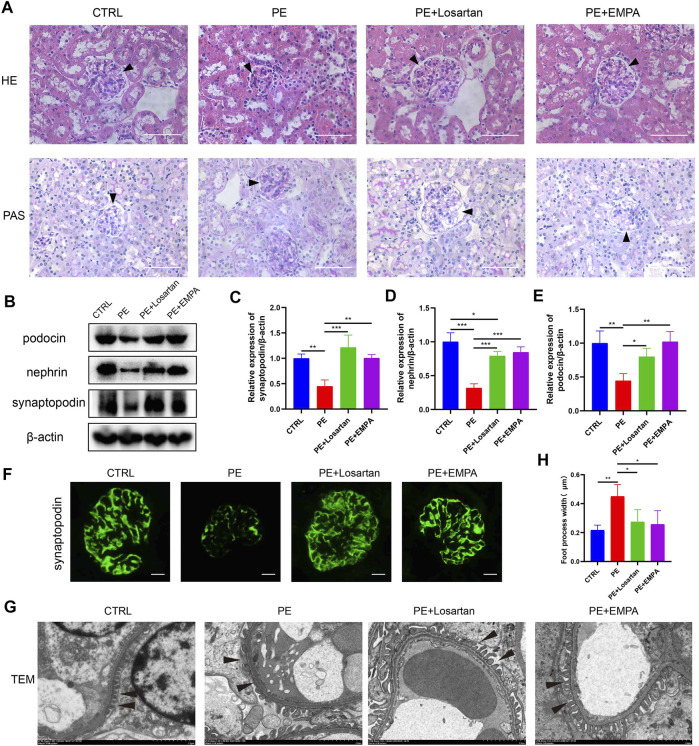
FIGURE 2.
EMPA ameliorated renal injury and podocytopathy in AT1-AA-induced PE mice. (A) Representative hematoxylin-eosin (HE) and periodic acid-Schiff (PAS) images of kidneys from different groups (scale bar represents 50 μm), Bowman’s spaces are indicated by arrowheads. (B) Representative Western blots for synaptopodin, nephrin and podocin in the glomeruli of kidney sections. Semiquantitative analysis of Western blots for (C) synaptopodin (n = 3), (D) nephrin (n = 3) and (E) podocin (n = 3). (F) Representative immunofluorescence images of synaptopodin in kidneys of different groups. Scale bar: 10 μm. (G) Representative electron micrographs of glomeruli from control and PE mice treated with vehicle, EMPA or losartan. Podocyte foot processes are indicated by arrowheads. Scale bar: 2 μm. (H) Quantitative podocyte foot process width (n = 3). Data are expressed as the mean ± SEM and were analyzed by ANOVA with LSD post hoc test. *p < 0.05, **p < 0.01, ***p < 0.001.

