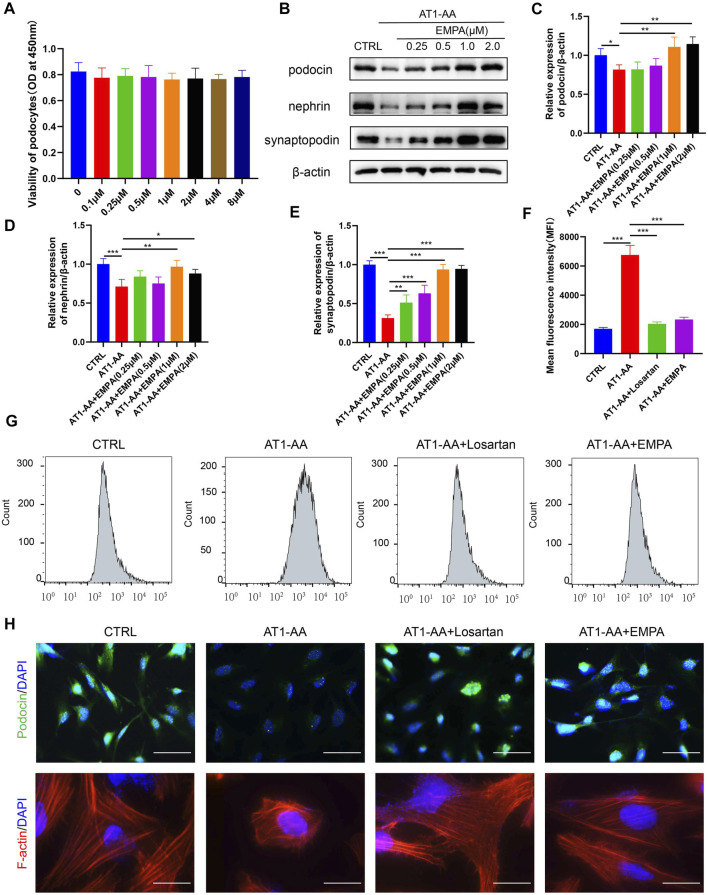
FIGURE 3.
EMPA limited AT1-AA-induced podocyte damage in vitro. (A) CCK8 assays of the effect of EMPA on podocyte viability (n = 3). (B) Representative Western blots for synaptopodin, nephrin and podocin in cultured podocytes. Semiquantitative analysis of Western blots for (C) synaptopodin (n = 3), (D) nephrin (n = 3) and (E) podocin (n = 3). (F) The graph displays the mean fluorescence intensities (MFIs) obtained from flow cytometric analysis of intracellular ROS (n = 3). (G) Representative flow cytometry histogram for DCF in the four groups. (H) Representative images of immunofluorescence staining for podocin and F-actin. Scale bars: upper panel, 50 μm; lower panel, 20 μm. Data are expressed as the mean ± SEM and were analyzed by ANOVA with LSD post hoc test. *p < 0.05, **p < 0.01, ***p < 0.001.

