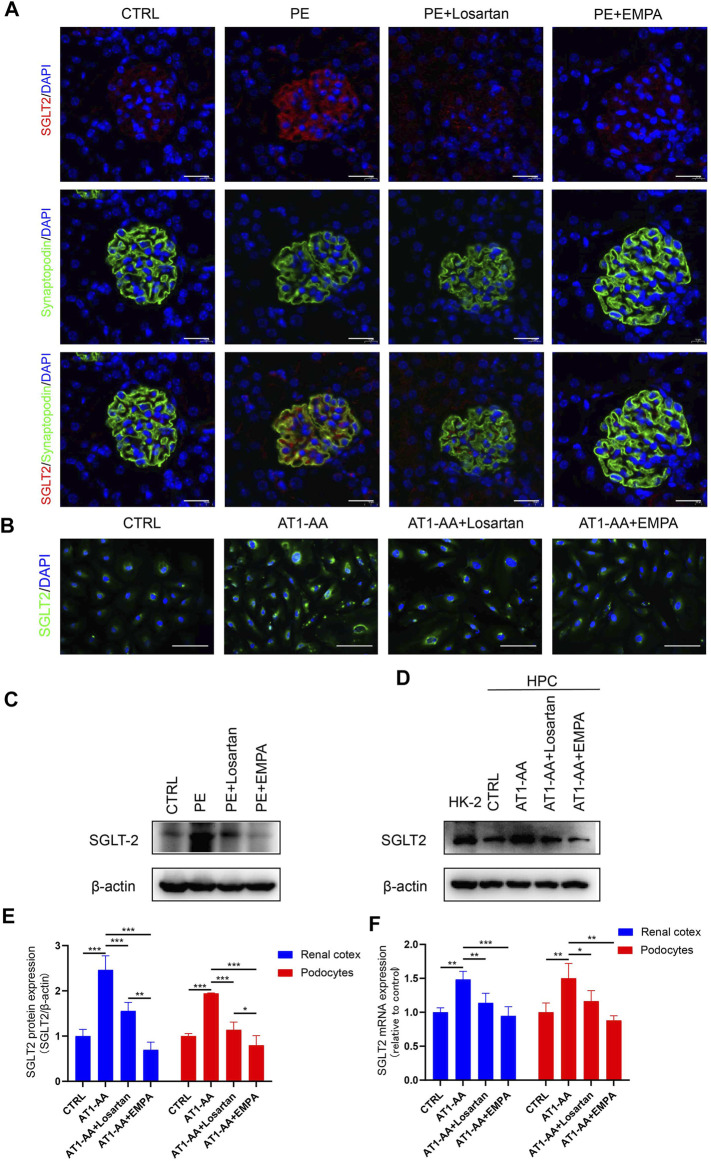
FIGURE 4.
SGLT2 is expressed in podocytes and upregulated by AT1-AA induction in vivo and in vitro. (A) Representative fluorescence pictures of SGLT2 (red) and synaptopodin (green) in control and PE mouse glomeruli. Sections were counterstained for DNA (blue). Scale bar: 20 μm. (B) Representative images of immunofluorescence staining for SGLT2 (green) in podocytes. Scale bar: 50 μm. (C) Representative Western blots and (E) densitometric analysis of SGLT2 protein in renal cortex. (D) Representative Western blots and (E) densitometric analysis of SGLT2 protein in cultured human podocytes (n = 3). (F) Podocytes SGLT2 and mouse renal cortex Sglt2 mRNA expression was evaluated by real-time qPCR analysis (n = 3). Data are expressed as the mean ± SEM and were analyzed by ANOVA with LSD post hoc test. *p < 0.05, **p < 0.01, ***p < 0.001.

