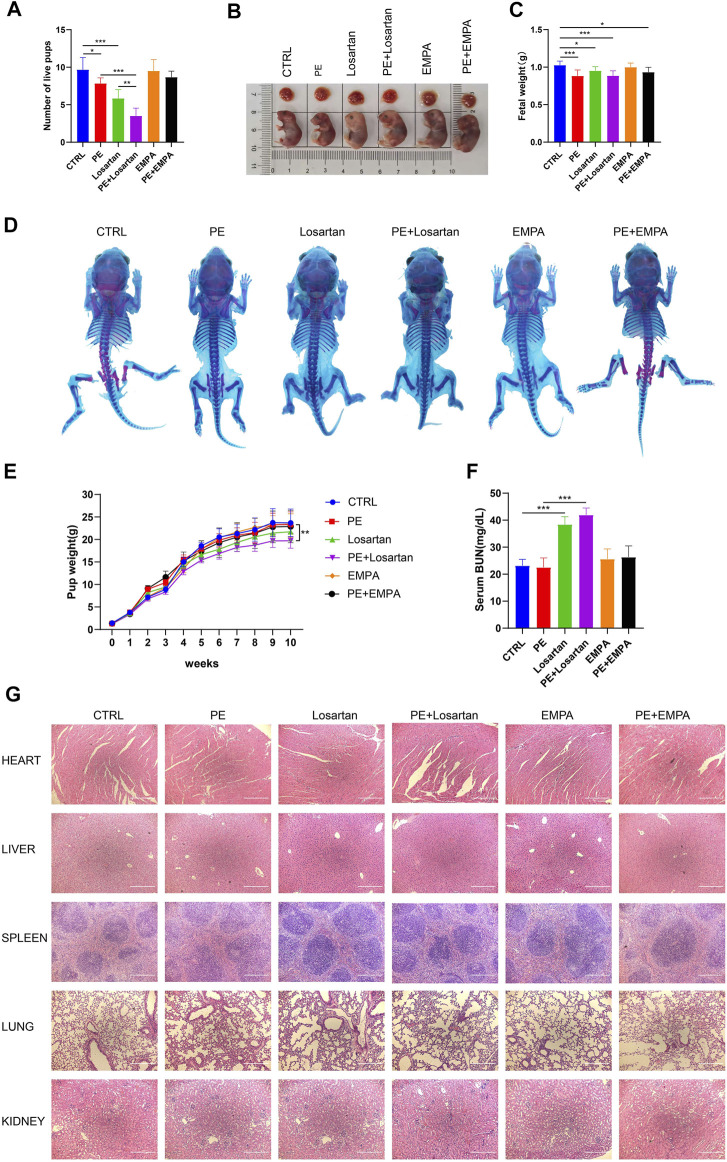
FIGURE 7.
Effects of EMPA on fetal outcomes in PE mice. (A) Histogram showing the number of live pups in each group (n = 6). (B) Representative images showing the gross morphology of placentae (top) and embryos (bottom) in each group. (C) Histogram showing the fetal weight in each group (n = 6). (D) Whole-mount alcian blue and alizarin red staining of 1-week-old offspring in each group. (E) Pup weights recorded from 0 to 10 weeks of each group (n = 8). (F) Serum BUN levels of each group of offspring at 10 weeks of age (n = 6). (G) H&E staining of hearts, livers, spleens, lungs and kidneys of offspring mice in each group. Scale bar: 200 μm. The results are expressed as the mean ± SEM. *p < 0.05, **p < 0.01, ***p < 0.001.

