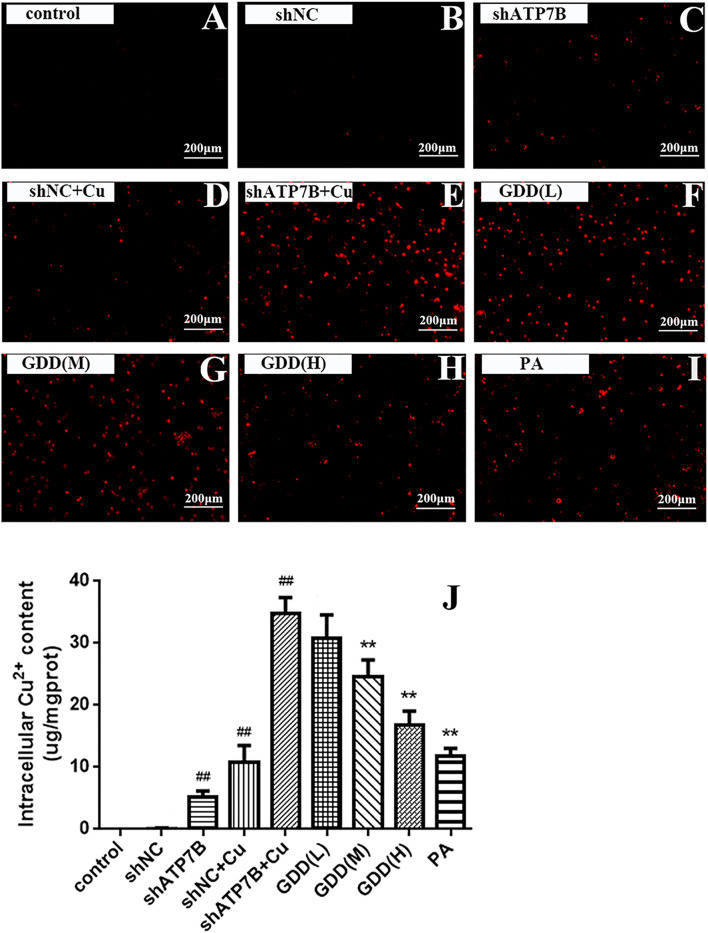
FIGURE 2.
(A–I) Cu2+ fluorescence intensity of copper-laden HLD hepatocytes treated with GDD by fluorescence microscope (magnification = ×100); (J) effect of GDD on content of Cu2+ in copper-laden HLD hepatocytes ( ). # p < 0.05, ## p < 0.01 compared with control group; * p < 0.05, ** p < 0.01 compared with shATP7B + Cu group.

