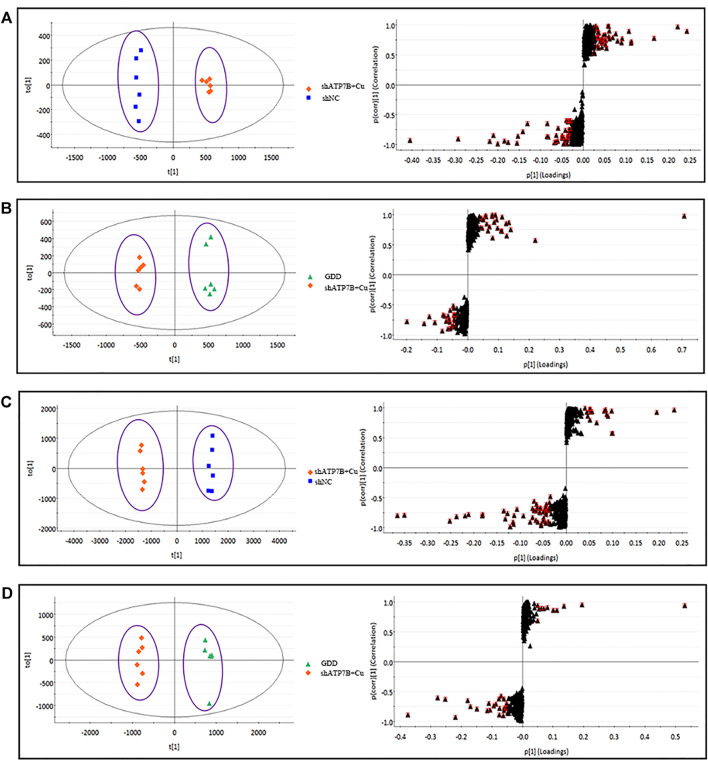
FIGURE 6.
(shNC group, shATP7B + Cu group, and GDD group) OPLS-DA score and its corresponding S-plot for differential analysis between different groups of cell samples in HILIC-Q-TOF/MS negative and positive ESI mode. [(A).NEG-R2Y = 1, Q2 = 99%; (B). NEG-R2Y = 99%, Q2 = 98%; (C). POS- R2Y = 1, Q2 = 98%; (D). POS- R2Y = 99%, Q2 = 96%].

