FIGURE 8.
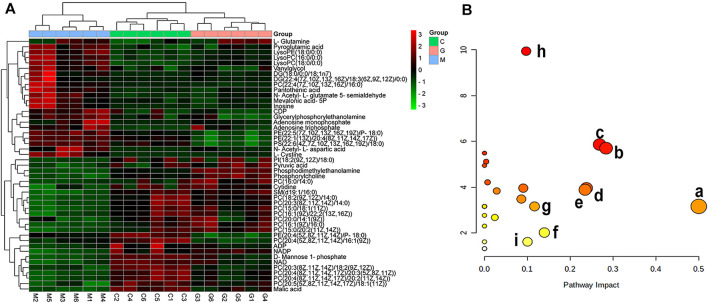
(A) Hierarchical clustering heatmap of 47 potential biomarkers. (Columns represent samples in different groups, and rows represent different biomarkers. Different colors, from green to black to red, represent concentration differences, from small to large, in different samples. C, G, and M in figure correspond to shNC group, GDD group, and shATP7B + Cu, respectively); (B) Results of metabolic pathway analysis of copper-laden HLD hepatocytes [each point represents a metabolic pathway: (a) D-glutamine and d-glutamate metabolism; (b) alanine, aspartate, and glutamate metabolism; (c) glycerophospholipid metabolism; (d) pyruvate metabolism; (e) nicotinate and nicotinamide metabolism; (f) terpenoid backbone biosynthesis; (g) fructose and mannose metabolism; (h) arginine biosynthesis; (i) Glycolysis/Gluconeogenesis].

