Figure 3.

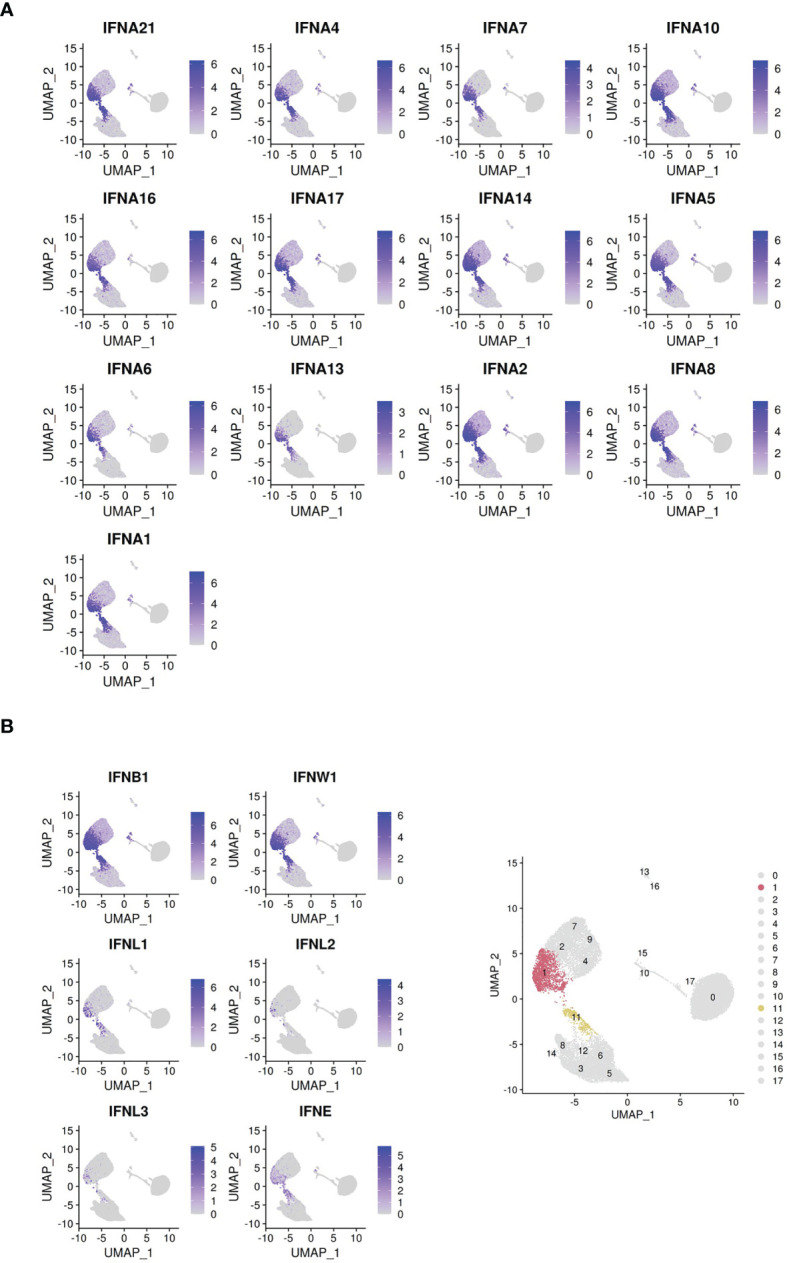
Clusters colored by IFN-I gene expression. (A) Cells colored by IFN-α subtype gene expression. (B) Cells colored by non-IFN-α type I interferon gene expression. Bottom right panel: highlight of clusters 1 and 11 identified by Seurat.

Clusters colored by IFN-I gene expression. (A) Cells colored by IFN-α subtype gene expression. (B) Cells colored by non-IFN-α type I interferon gene expression. Bottom right panel: highlight of clusters 1 and 11 identified by Seurat.