Figure 1.
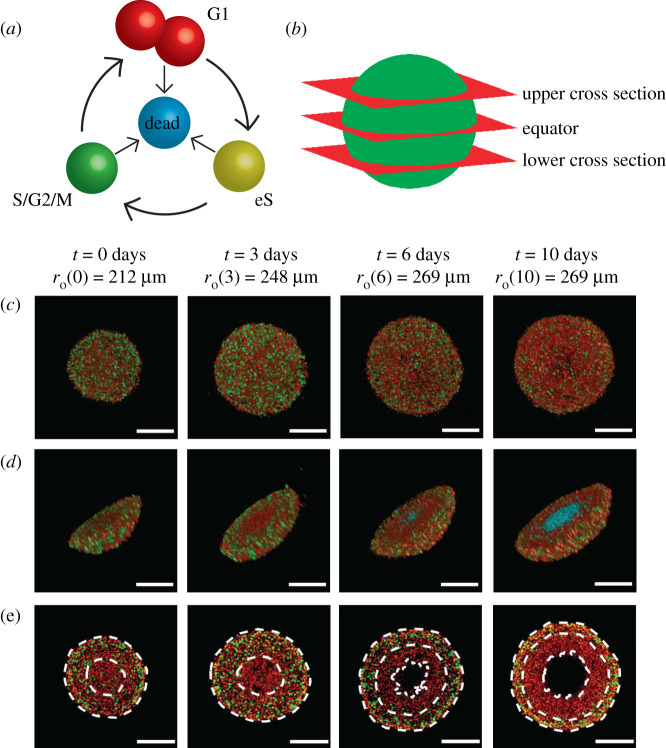
Motivation. (a) A schematic of the cell cycle, indicating the transition between different cell cycle phases, and their associated FUCCI fluorescence. Red, yellow and green colouring indicates cells in G1, eS and S/G2/M phase, respectively. (b) Locations of the upper cross section, equator and lower cross section. (c–e) Experimental images of a tumour spheroid using the human melanoma cell line WM793B at days 0, 3, 6 and 10 (after formation) showing. (c) Full spheroids, viewed from above, (d) spheroid hemispheres and (e) spheroid slices, where the cross section is taken at the equator. White dashed lines in (e) denote the boundaries of different regions, where the outermost region is the proliferative zone, the next region inward is the G1-arrested region, and the innermost region at days 6 and 10 is the necrotic core. In (a) and (d), we use cyan colouring for dead cells, which assist in identifying the necrotic core in (d). Spheroid outer radii are labelled alongside their corresponding time points, and scale bars represent 200 μm.

