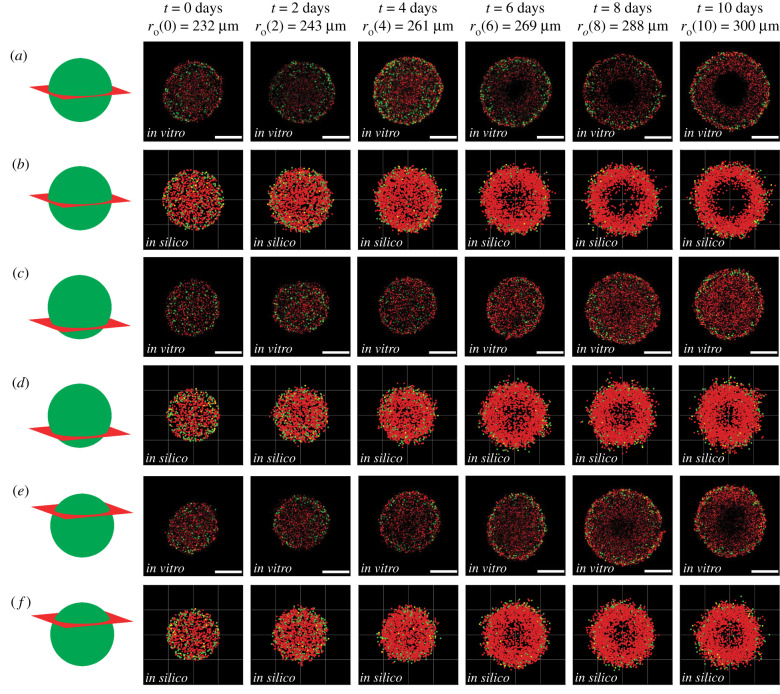
Figure 3.
Comparison of in vitro and in silico 4D spheroids. Experimental results (a,c,e) are compared with simulation results (b,d,f) by examining 2D slices at the equator, lower and upper cross section, respectively. Agent colour (red, yellow, green) corresponds to FUCCI labelling (G1, eS, S/G2/M). Schematics in the left-most column indicate the location of the 2D cross section. The images are taken at (a–b) the equator, (c–d) the lower cross section, and (e–f) the upper cross section. Experimental spheroid radii at the equator are labelled at each time point, and scale bars represent 200 μm.

