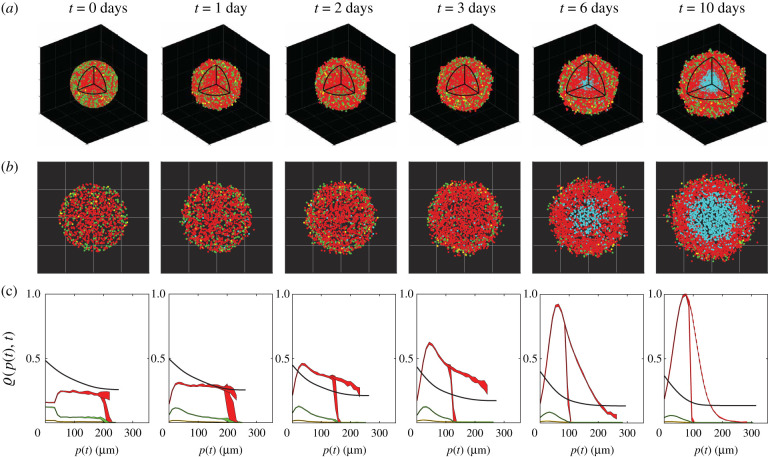
Figure 4.
Typical IBM simulation, showing: (a) visualizations of in silico spheroids including dead agents (cyan) and (b) cross sections through the spheroid equator with dead agents. (c) Relative concentrations ϱ(p, t) of nutrient (black) and cycling red, yellow and green agents (coloured appropriately), based on distance from the periphery , averaged over 10 identically prepared simulations. The dashed red line shows the relative density of arrested red agents, also averaged over 10 simulations with identical initial conditions. For nutrient, ϱ(p, t) = c. For agents, ϱ(p, t) is the relative agent density (electronic supplementary material, S10). Shaded areas represent plus or minus one standard deviation about the mean, and are non-zero as a consequence of stochasticity in the model, even though the 10 simulations start with identical populations and radii.

