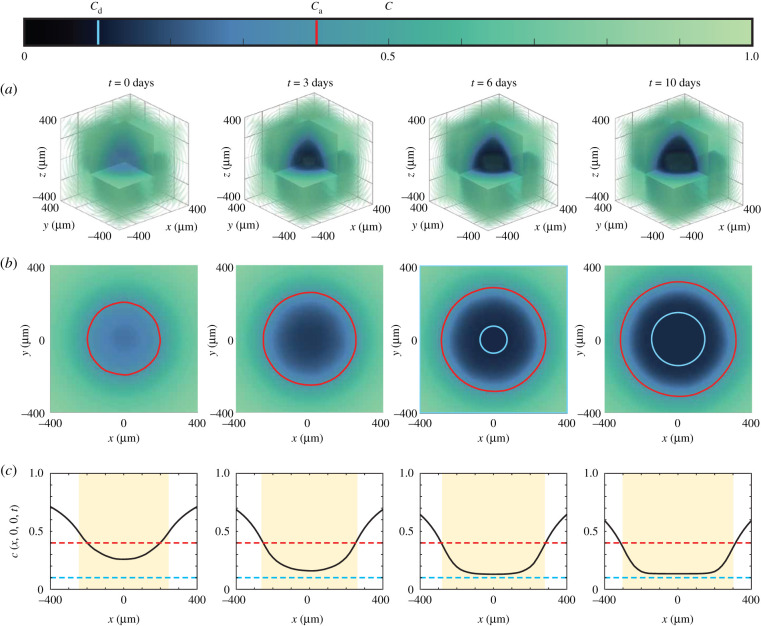
Figure 5.
Nutrient concentration profiles (a) in three spatial dimensions, (b) at the equator z = 0, with the arrest critical level ca shown in red, and the size of the necrotic region in white. (c) Nutrient profiles along the midline y = z = 0, where the shaded region represents the size of the spheroid, and the red and cyan lines are the critical levels for arrest and death, ca and cd respectively. The colour bar corresponds to the profiles in (a–b), and denotes the values ca (red) and cd (cyan).

