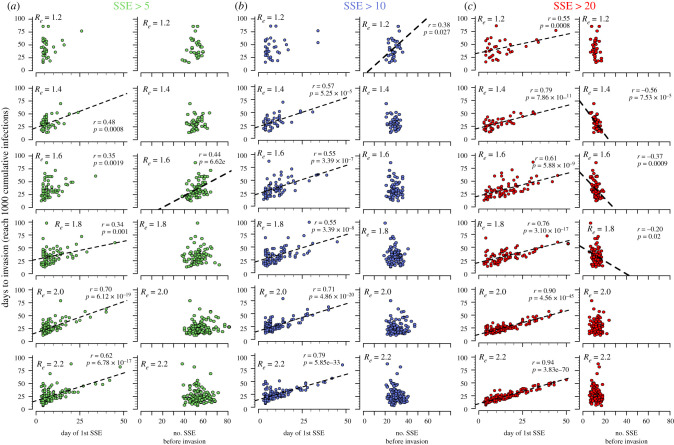
Figure 4.
Relationship between timing and number of SSEs and time to invasion. Invasion is defined as 1000 cumulative infections. Scenarios assume varying definitions of SSEs as (a) greater than 5, (b) greater than 10 and (c) greater than 20 secondary infections on any day. Each plot also varies the invading variant reproductive number (noted in bold Re). Correlations were tested between the day of the first SSE as well as the number of SSEs against the time of invasion (defined as reaching 1000 cumulative infections). An early day of the first SSE predicts more rapid time to invasion, particularly when the invading variant had higher Re and an SSE is defined as greater than 20 infections in a day (see lower red panels). The total number of SSEs was generally not predictive of time to invasion. Pearson correlation coefficient (r) and corresponding trendlines are only noted in plots for which p < 0.05.

