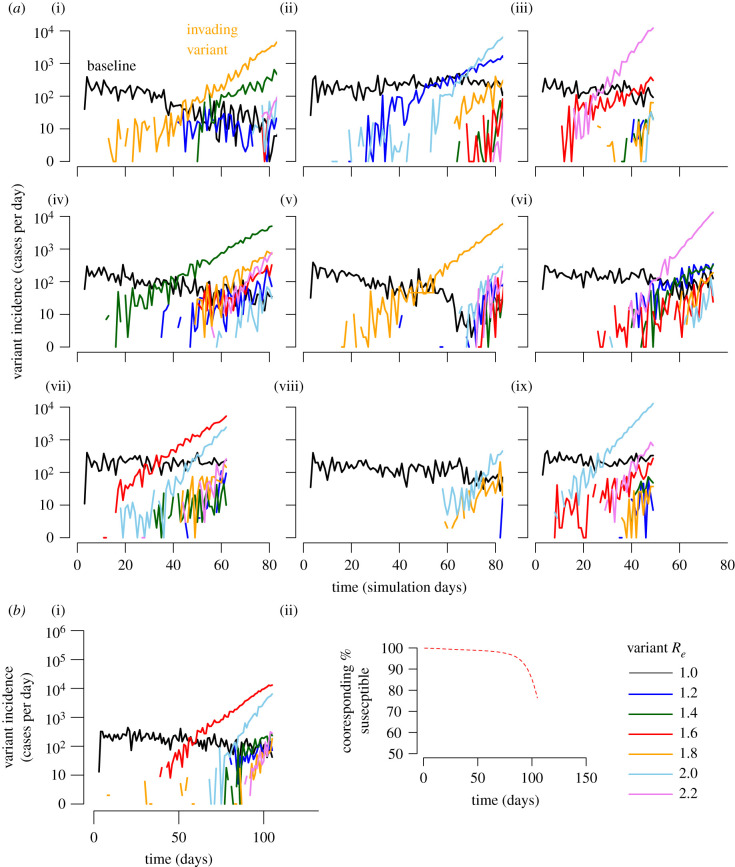
Figure 5.
New variant predominance depends on timing of variant introduction, variant effective reproductive numbers and numbers of ongoing infections. (a) Nine out of 100 simulations starting with 1000 infections of a baseline variant (black line) with Re = 1 are shown. New variants (e.g. orange line in (i)) are randomly generated in 1% of transmissions and coloured according to Re (drawn from a uniform distribution in bins of 0.2). The first new variant to reach 10 cases per day usually predominates though occasionally subsequent more-transmissible variants will expand and reach predominance (light blue in (ii)). Third-generation new variants become much more common as second-generation variants increase the total number of circulating infections (e.g. many lines in (iv, vi) after day 50). (b) A single example of a simulation with 1000 infected individuals but tracking until 250 000 cumulative infections admits similar kinetics and demonstrates only minor depletion of susceptible individuals.

