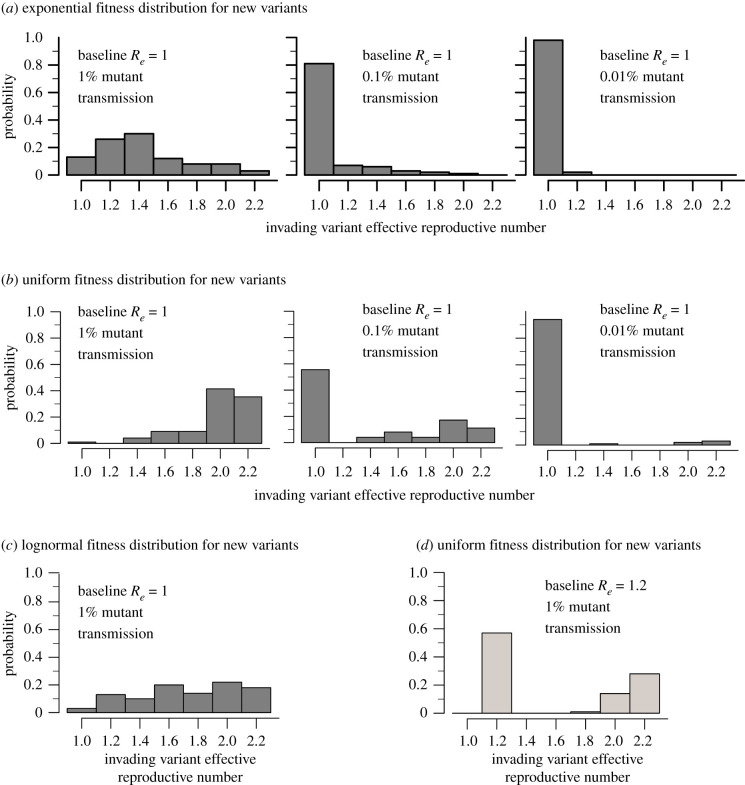
Figure 6.
Histograms of Re of invading variants. Given the assumption that 1%, 0.1% and 0.01% of new infections result in transmission of a new variant, we calculated the probability of predominance of new variants with different fitness drawn from an exponential (a), uniform (b) or lognormal (c) distribution. A lower frequency less than 1% of new variant introductions increased the likelihood that the baseline variant with Re = 1 continued to predominate. (d) If the baseline variant had Re = 1.2, it had a much higher chance (approx. 50%) of remaining dominant even with 1% variant generation unless the emerging variants had high transmissibility (i.e. Re > 1.8).

