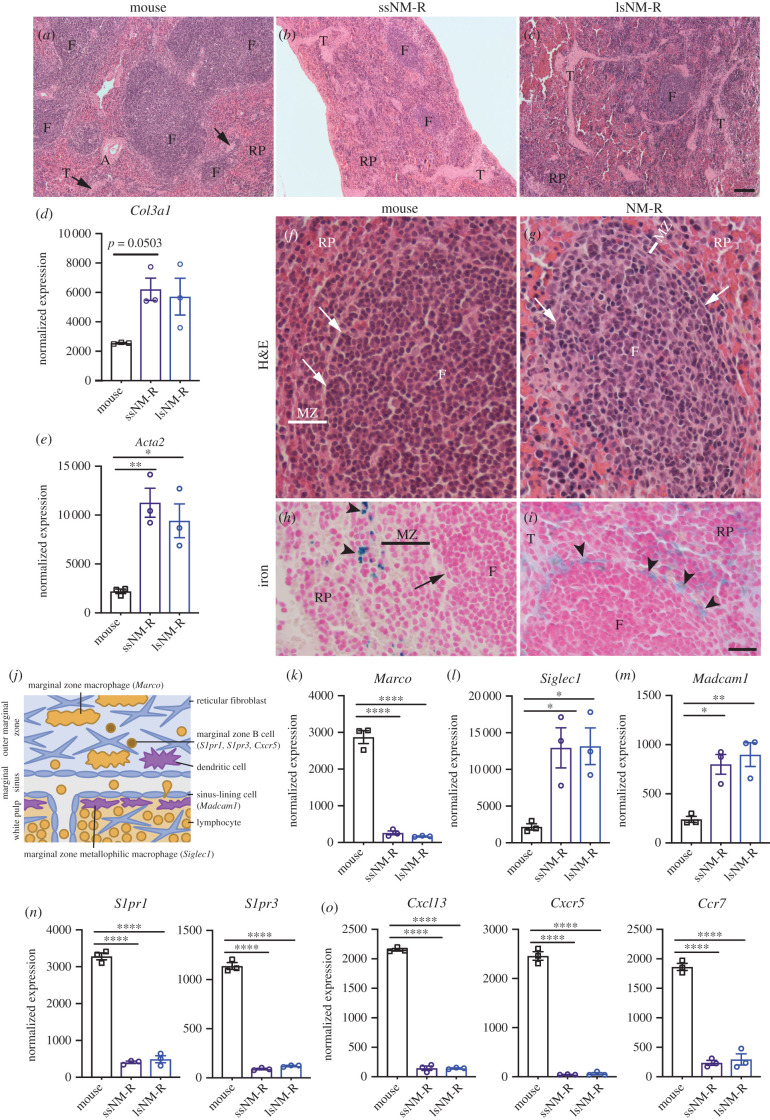
Figure 4.
NM-R spleen shows a reduced white pulp compartment and a thin marginal zone. (a–c) H&E staining of the spleen of ssNM-R (b) and lsNM-R (c) in comparison to mouse (a). Note the increase in red pulp/white pulp ratio with reduced number and size of follicles (F) and increased number of trabeculae (T, arrow) in NM-R spleens. (d–e) Increase in normalized RNA expression levels of Col3a1 (d) and of Acta2 (e) in NM-R spleens compared to mouse. (f–g) H&E staining of mouse (f) and NM-R (g) spleen showing the presence of follicles (F) with a thinner marginal zone (MZ) in NM-R compared to mouse. (h–i) Iron staining of mouse (h) and NM-R (i) spleen showing stained macrophages (blue iron staining, arrowhead) close to the follicle in NM-R but not in mouse marginal zone. MZ: marginal zone (black or white line), RP: red pulp, marginal sinus (arrow in f–h). (j) Schematic representation of the mouse marginal zone and its cell types with their expression markers. (k–o) Normalized RNA expression levels of Marco (MZ macrophage marker) (k), of Siglec1 (MZ metallophilic macrophage marker) (l), of Madcam1 (sinus lining cells marker) (m), of markers of MZ B cells (S1pr1, S1pr3) (n) and of chemokine-chemokine receptors involved in the lymphocytes migration into the white pulp (Cxcl13, Cxcr5 and Ccr7) (o). One-way ANOVA with Tukey's post hoc test for multiple comparisons: p value *<0.05, **<0.01 and ****<0.0001. Data is based on RNAseq and bars represent mean ± s.e.m. Scale bar = 100 µm (a–c) and 20 µm (f–i).

