Figure 7.
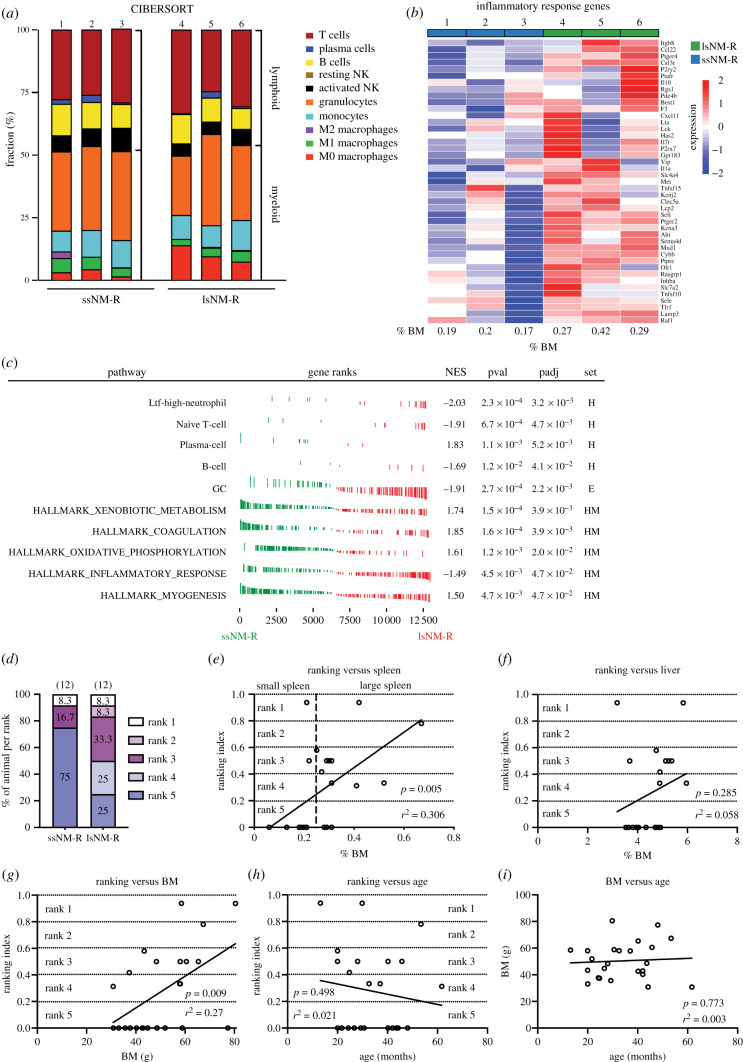
Hyperplasic spleens in lsNM-R are associated with higher rank. (a) Relative fraction of immune cells predicted by CIBERSORT in ssNM-R and lsNM-R spleens (n = 3 per cohort). NK: natural killer cell. (b) Heatmap representation of leading edge inflammatory response genes for ssNM-R and lsNM-R spleens identified by hallmark GSEA analysis. (c) GSEA of transcriptomic data from ssNM-R and lsNM-R spleens (n = 3 per cohort). NES, normalized enrichment score; pval, p value; padj, adjusted p value. Significantly enriched pathways using NM-R cell-type signatures from Hilton and colleagues (H) [17], Emmrich and colleagues (E) [72] and established hallmark pathways (HM). GC: granulocytes. (d) Percentage of animal per rank and per cohort. Note that only 25% of the lsNM-R has the lowest ranking index (rank 5) compared to 75% in ssNM-R. (e–h) Correlation between rank of NM-R in their colony (ranking index) and spleen size (%BM) (e), liver size (%BM) (f), body mass (BM) (g) or age (h), showing that the ranking index of NM-Rs positively correlated with their spleen size and BM but not with their liver size and age. (i) Body mass and age of NM-Rs poorly correlated). Simple linear regression analysis was used to test goodness of fit: the calculated r square (r2) and p-value are given for each line. NM-Rs n = 24 including n = 12 ssNM-R, n = 12 lsNM-R.

