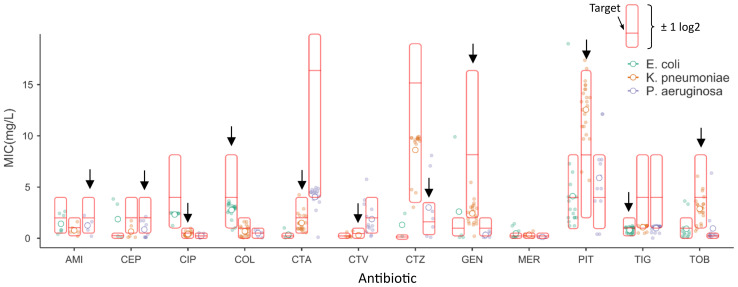
Figure 3.
Repeatability per tested antibiotic for the three quality control strains. The linear-scale MIC outputs (i.e. not right-censored for direct comparison with BMD) from the QuickMIC instrument are shown for each bacteria-antibiotic pair relative to the reference MIC value obtained using the BMD method (middle red horizontal line marked “Target”), with the full interval corresponding to essential agreement indicated (by the red box). Open circles correspond to the mean MIC values for each antibiotic, whereas the closed circles correspond to all collected MIC data points for all tested combinations of bacteria and antibiotics. The black arrow identifies the on-scale QC strain for respective antibiotic.

