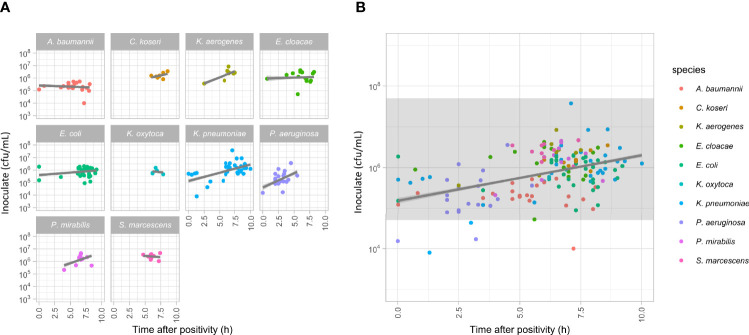
Figure 4.
(A) Measurement of the amounts of bacteria in blood culture samples plotted against the time from positivity signal of the blood culture bottles to sampling. Linear regression lines (grey lines) are presented for each dataset, no significant correlations were detected. (B) Plot showing all the data presented in panel a, together with an indication of the range of sample concentrations compatible with downstream MIC analyses using the QuickMIC system (grey field).

