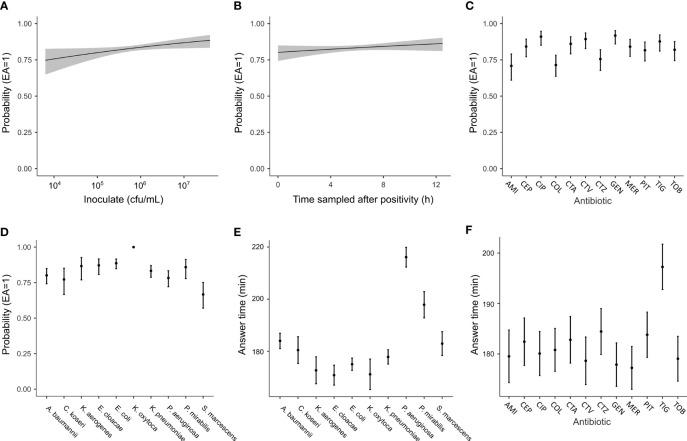
Figure 5.
Analyses of parameters that can affect the performance of the QuickMIC test using logistic regression. The probability to achieve a result within EA as compared to the standard BMD method when analyzing spiked blood cultures is shown, and plotted against initial inoculate bacteria concentration (A), the amount of time elapsed after initial indication of blood culture bottle positivity and sampling (B) or with regard to type of antibiotic (C) or bacterial species (D). (E, F) show the estimated marginal means for the answering times grouped by either antibiotic or species, respectively. Grey fields (in A, B) and error bars (C–F) indicate 95% confidence interval in the estimated marginal means.

