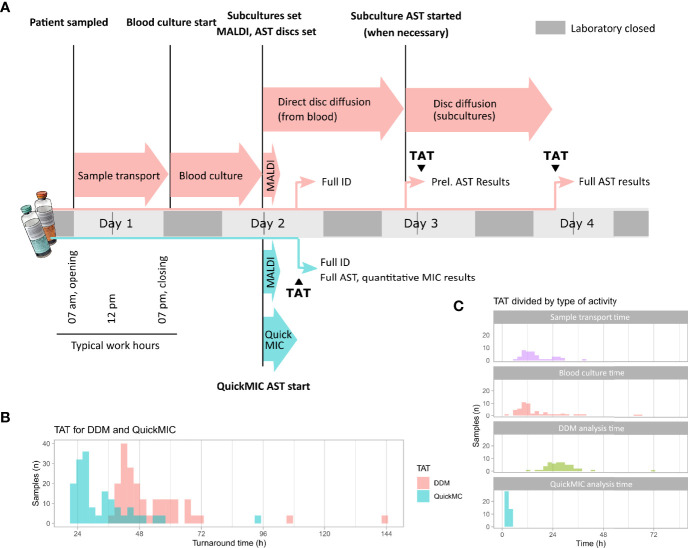
Figure 6.
(A) Overview of the analyses of total turnaround time (TAT) to compare the QuickMIC method with the disc diffusion method (DDM). After patient sampling and sample transport, blood cultures were started. After positivity and during working hours, confirmed Gram-negative samples were run on QuickMIC as well as by the routine laboratory standard process (Maldi-TOF, rapid DDM followed by DDM from isolated colonies). (B) The difference in TAT between QuickMIC and DDM. (C) Breakdown of the TAT into the time periods spent during sample transport, blood culture incubation, and finally time for MIC analyses using either DDM or QuickMIC.

