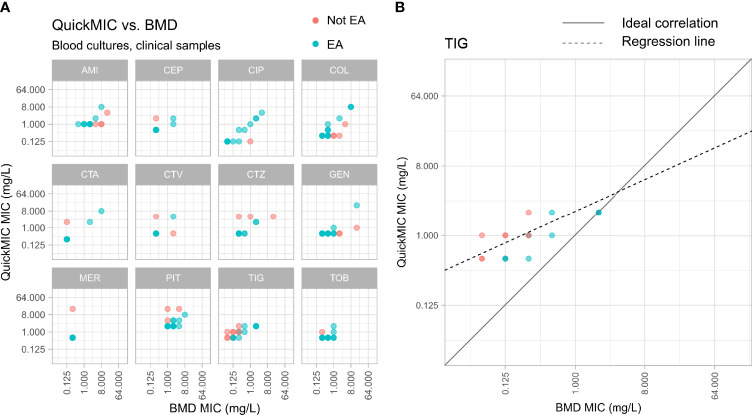
Figure 7.
(A) Distribution of MIC value results from the reference BMD method (x-axis) and the QuickMIC method (y-axis), from testing of bacteria in clinical blood culture samples in response to the 12 tested antibiotics. MIC-values obtained by the QuickMIC method that are within EA in comparison to results from BMD assays are shown in blue, and MIC values not in agreement between the two methods are shown in red. (B) Enlarged panel showing results obtained for tigecycline (TIG). Here, a tendency for that QuickMIC in this case produces higher MIC values than the BMD reference method can be seen. The density of datapoints is represented by color gradient.

