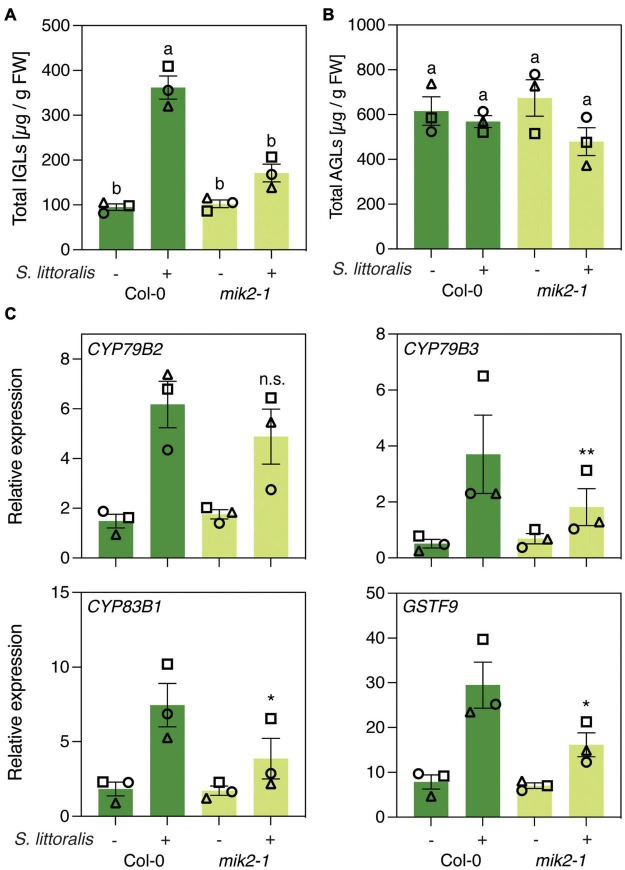
FIGURE 2.
MIK2 regulates indole glucosinolate biosynthesis in response to herbivory. (A,B) Glucosinolate levels in Col-0 and mik2-1. Absolute levels of total IGLs (A) and AGLs (B) were measured by UPLC-QTOF after 2 days of Spodoptera littoralis feeding. Non-infested plants served as controls. Values represent means ± SEM of three independent biological replicates. Letters denote statistical differences (ANOVA followed by Tukey’s HSD). Different symbols indicate different biological replicates. Values for individual glucosinolate species are given in Supplementary Table S1. (C) Expression of genes involved in indole glucosinolate biosynthesis. Expression of CYP79B2, CYP79B3, CYP83B1, and GSTF9 was measured by qPCR after 2 days of Spodoptera littoralis feeding and normalized to the housekeeping gene SAND. Non-infested plants served as controls. Values represent means ± SEM of three independent biological experiments. Asterisks denote statistical differences between S. littoralis-induced expression levels of Col-0 and mik2-1: *P < 0.05, **P < 0.01, n.s., no significant difference (ratio paired t-test). Different symbols indicate different biological replicates.

