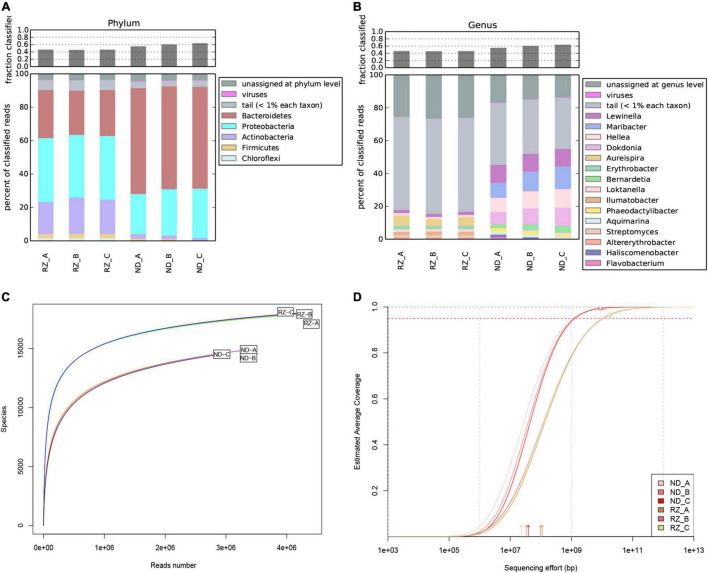
FIGURE 1.
Taxonomic profiling, Rarefaction curves and Non-pareil curves of the Pyropia haitanensis microbial dataset. Microbial community structures of P. haitanensis at the phylum (A) and genus (B) level based on non-redundant NCBI BLAST database. Phyla/Genera in different colors are shown in the legend. Categories with relative abundance lower than 1% are merged and defined as “tails”. Reads that are not assigned to any of the above levels are defined as “unassigned at phylum/genus level”. Rarefaction curves (C) and Non-pareil curves (D) showing estimated average coverage in metagenomic datasets. The empty circles (D) indicate the size and estimated current average coverage of the samples. RZ, Rizhao; ND, Ningde.

