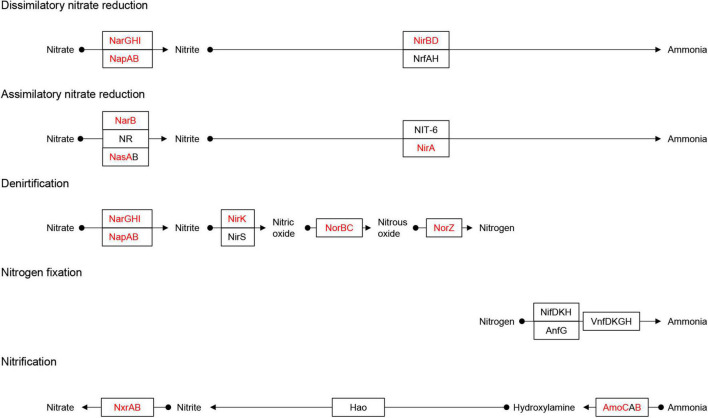
FIGURE 4.
Identification of the Nitrogen metabolism pathway. Adapted from KEGG (https://www.kegg.jp/pathway/map00910). Solid black circles indicate chemical compounds. Squares indicate gene names. The red fonts in the square indicates the names of genes identified in the MAGs, and the black fonts indicates genes that were not identified. The arrow indicates the direction of the reaction pathway.

