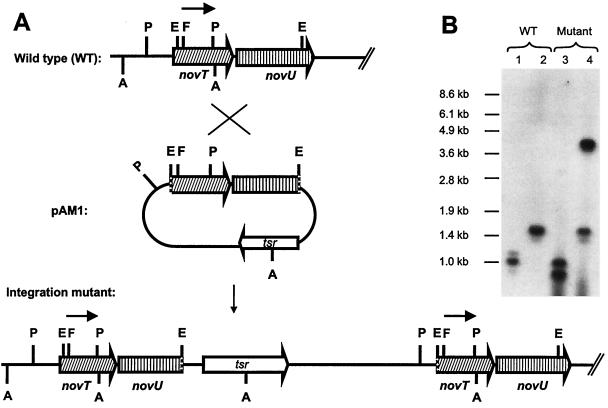
FIG. 4.
Insertional gene inactivation of deoxysugar biosynthesis. (A) Schematic presentation of the integration event. The 520-bp FspI-PstI-DNA fragment used as the probe is indicated as a black arrow. Relevant restriction sites are identified as follows: A, AccI; E, EcoRI; F, FspI; P, PvuII. tsr, Thiostrepton resistance. Hatched arrows indicate genes. (B) Southern analysis of S. spheroides NCIB 11891 wild type (WT) and a disrupted mutant. Lanes 1 and 2, genomic DNA of the wild type restricted with PvuII in lane 1 (expected band at 1.07 kb) and with AccI in lane 2 (expected band at 1.47 kb); lanes 3 and 4, genomic DNA of an integration mutant restricted with PvuII in lane 3 (expected bands at 1.07 and 0.91 kb) and AccI in lane 4 (expected bands at 1.47 and 3.98 kb).

