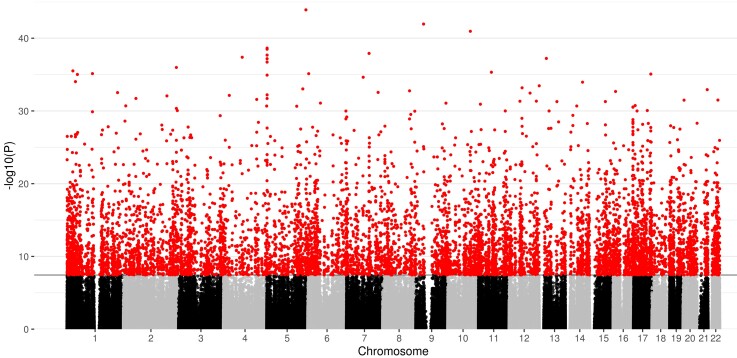
Figure 1.
Manhattan plot for the significance [−log10 (P-value) used for visualization purposes] of the association between gestational age at birth (weeks) and DNA methylation, following adjustment for covariates and surrogate variables. The solid horizontal line shows the genome-wide significance level and red dots above this line represent probes that are significant at this threshold (P < 3.6 × 10⁻⁸).

