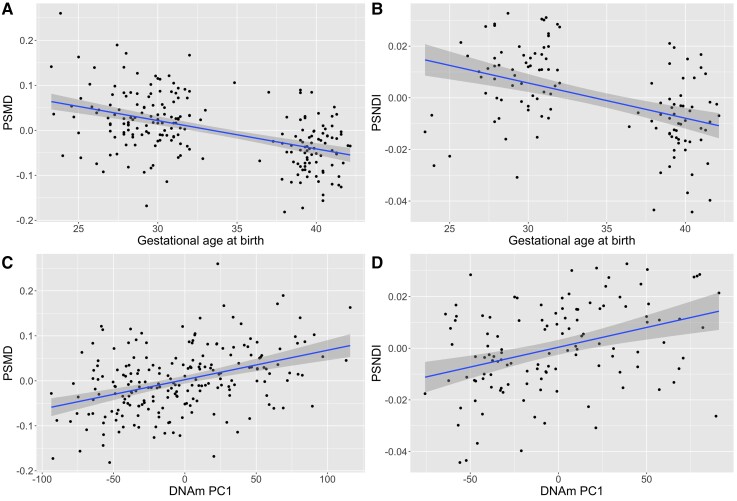
Figure 2.
Scatter plots with regression lines and 95% confidence intervals showing the relationships between gestational age at birth (weeks) and DNAm with PSMD and PSNDI, where peak width is the difference between the 95th and 5th centile of histogram values across the white matter skeleton. The associations between gestational age (weeks) and PSMD and PSNDI are shown in (A) and (B), respectively. The relationships between DNAm PC1 and PSMD and PSNDI are shown in (C) and (D), respectively. PS metrics are residualized for gestational age at scan; PSMD is additionally residualized for scanner variable.

