Figure 3.
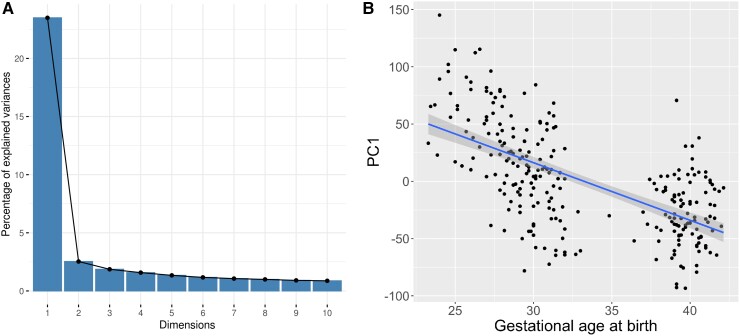
Variation in DNAm probes selected by EWAS captured by principal component analysis, and the relationship with gestational age (weeks). A. A scree plot showing percentage of variance accounted for by the first 10 components, with a sharp elbow after the first PC, accounting for 23.5% of variance. B. A scatter plot, with regression line, showing the relationship between gestational age at birth (weeks) and PC1 (r = −0.622) with 95% confidence intervals.

