
Figure 3.
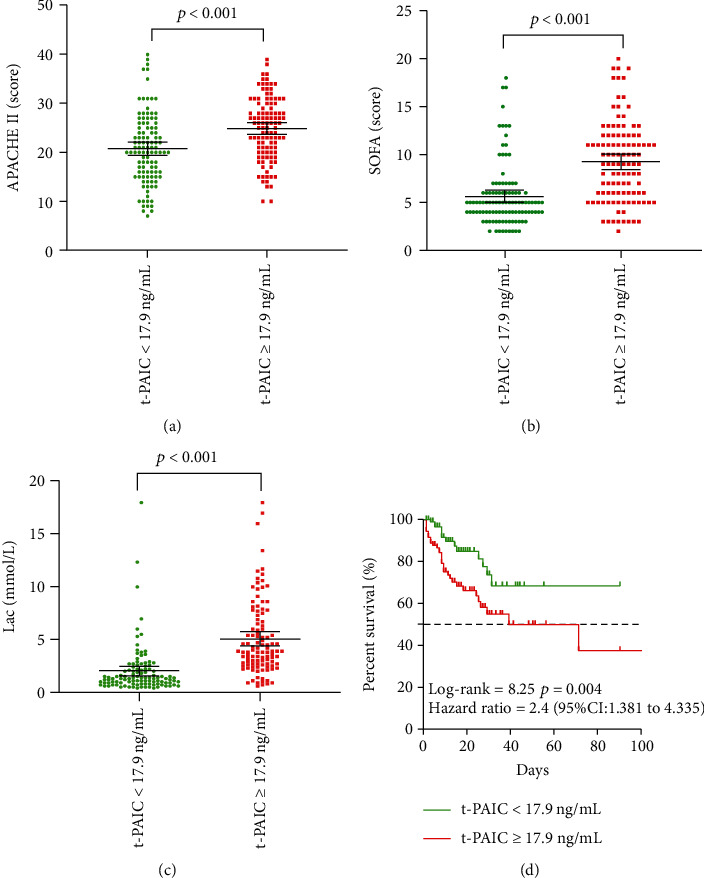
Comparison of propensity-score matched patients stratified based on optimal t-PAIC cut-off of 17.9 ng/mL. (a) Score on APACHE II. (b) Score on SOFA. (c) Lactate levels. (d) Kaplan-Meier survival curves.
Official websites use .gov
A
.gov website belongs to an official
government organization in the United States.
Secure .gov websites use HTTPS
A lock (
) or https:// means you've safely
connected to the .gov website. Share sensitive
information only on official, secure websites.
Comparison of propensity-score matched patients stratified based on optimal t-PAIC cut-off of 17.9 ng/mL. (a) Score on APACHE II. (b) Score on SOFA. (c) Lactate levels. (d) Kaplan-Meier survival curves.