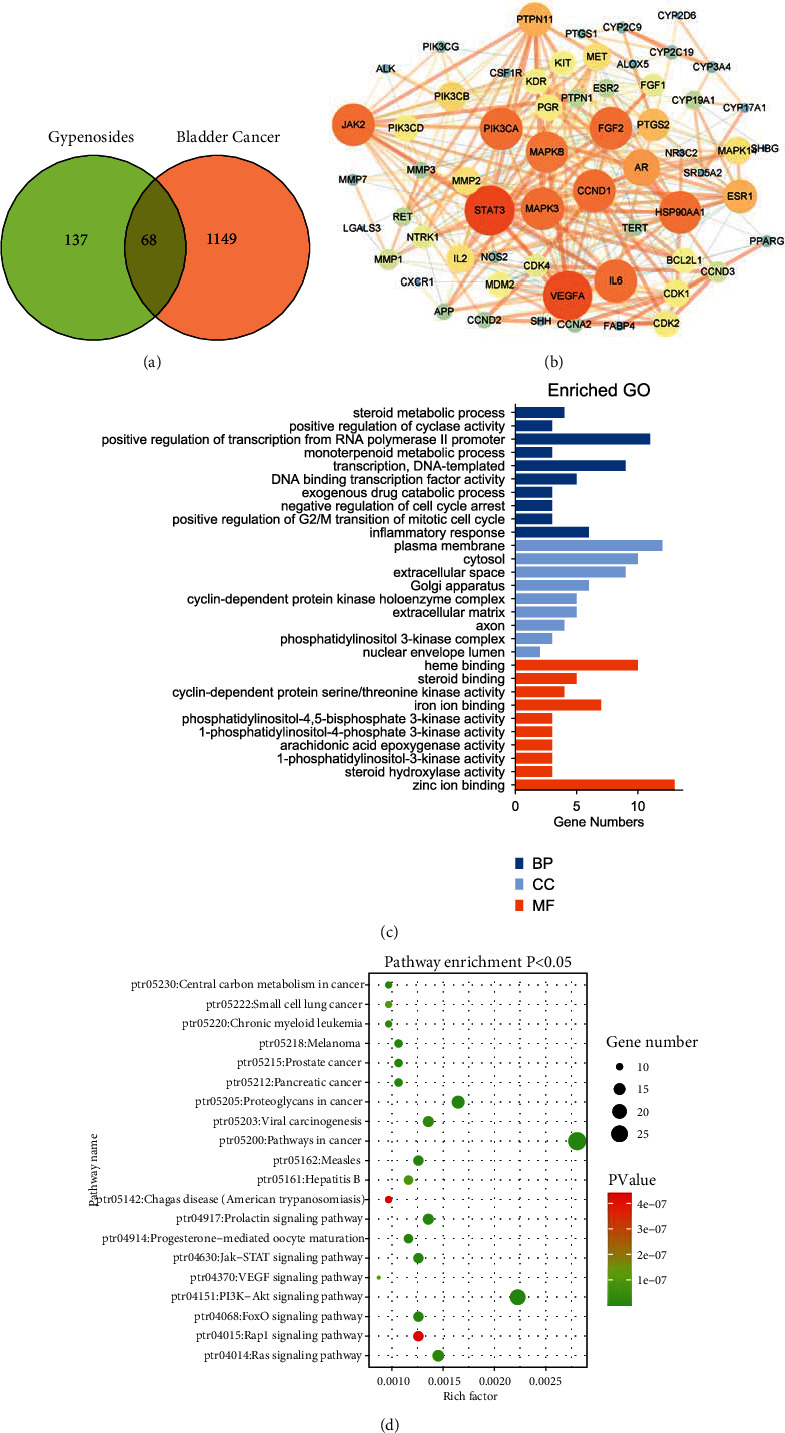
Figure 3.

Developing a compound-target network for gypenosides. (a) Venn diagram revealing the overlapping target genes for gypenosides and bladder cancer. (b) PPI network of antibladder cancer-associated proteins. Bigger node sizes and darker red colors indicate a higher degree of association. (c) Gene ontology (GO) functional annotation of potential targets of gypenosides. Cellular components (CC), biological processes (BP), and molecular functions (MF) were analyzed. (d) Kyoto Encyclopedia of Genes and Genomes (KEGG) enrichment analysis for potential signaling pathways of gypenosides. The top 20 pathways with lower P-values are visualized.
