
Figure 4.
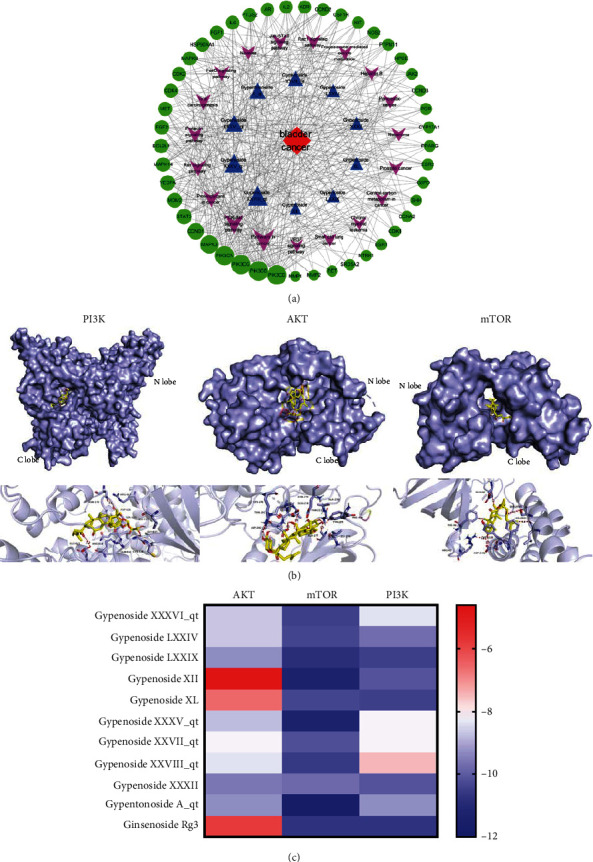
Modeling the potential targets of gypenosides. (a) Network of target genes for gypenosides against bladder cancer. The red diamond represents bladder cancer; blue triangles represent 10 gypenosides; purple arrows represent KEGG pathways; green circles represent the target genes of both gypenosides and bladder cancer. (b) Gypenosides interaction mode with PI3K, AKT, and mTOR, respectively. (c) The binding energy of the components in gypenosides binding with AKT, mTOR, and PI3K.