
Figure 5.
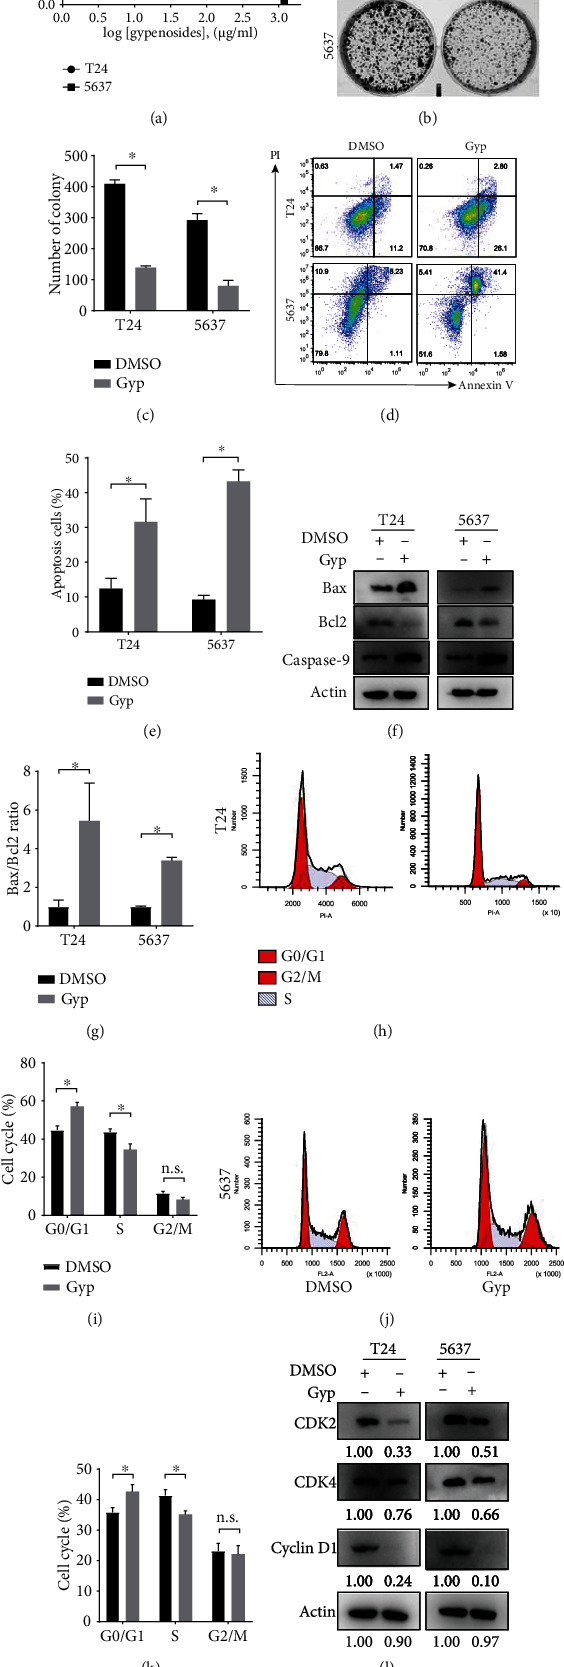
Gypenosides inhibited the proliferation and induced apoptosis of bladder cancer cells. (a) Cells were treated with gypenosides for 48 h, and a CCK8 assay was employed to assess viability. Errors bars show the standard deviation (SD) of the mean of three independent tests. (b) Five hundred cells were plated in a 6-well plate for eight days and treated with gypenosides or DMSO. (c) Quantification of colony formation assays. Student's t-test, Error bars show the SD of the mean for three replicate wells, ∗P < 0.05. (d) Flow cytometry was employed to analyze the staining of propidium iodide (PI) and annexin V in control or gypenoside-treated cells. (e) Quantification of the apoptosis ratio. Student's t-test, mean ± SD are given, ∗P < 0.05. (f) Western blot experiments indicating the expression levels of Bax, Bcl2, and Caspase 9 in the cells treated with DMSO or gypenosides. (g) The Bax/Bcl2 ratio was quantified by ImageJ. Student's t-test, mean ± SD are given, ∗P < 0.05. (h and i) The relative proportion of cell cycle phases in T24 cells treated with DMSO or gypenosides. Mean ± SD are given, n.s., no significant variation, ∗P < 0.05. (j and k) The relative proportion of cell cycle phases in 5637 cells treated with DMSO or gypenosides. Mean ± SD are given, n.s., no significant variation, ∗P < 0.05. (l) Immunoblot analysis of the expression of CDK2, CDK4, and Cyclin D1 quantified by ImageJ.