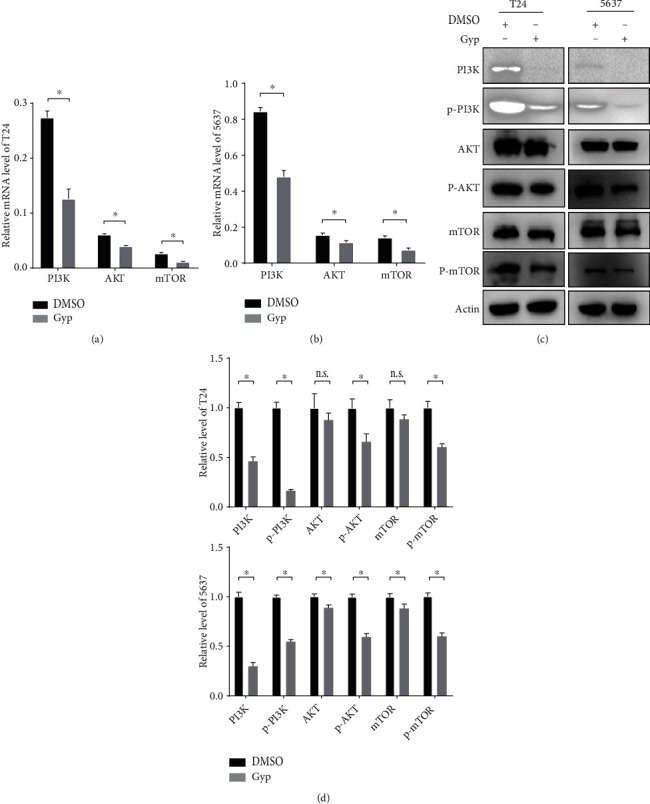
Figure 6.

Gypenosides suppress the PI3K/AKT/mTOR pathway. (a and b) RT-qPCR analysis of T24 and 5637 cells expressing the PI3K, AKT, and mTOR. Cells were pretreated with DMSO or gypenosides. Student's t-test, mean ± SD are given, ∗P < 0.05. (c) Immunoblot assay displaying the expression of proteins in 5637 and T24 cells. (d) Quantification of protein expression level. Two-way ANOVA. Error bars, mean ± SD. ∗P < 0.05.
