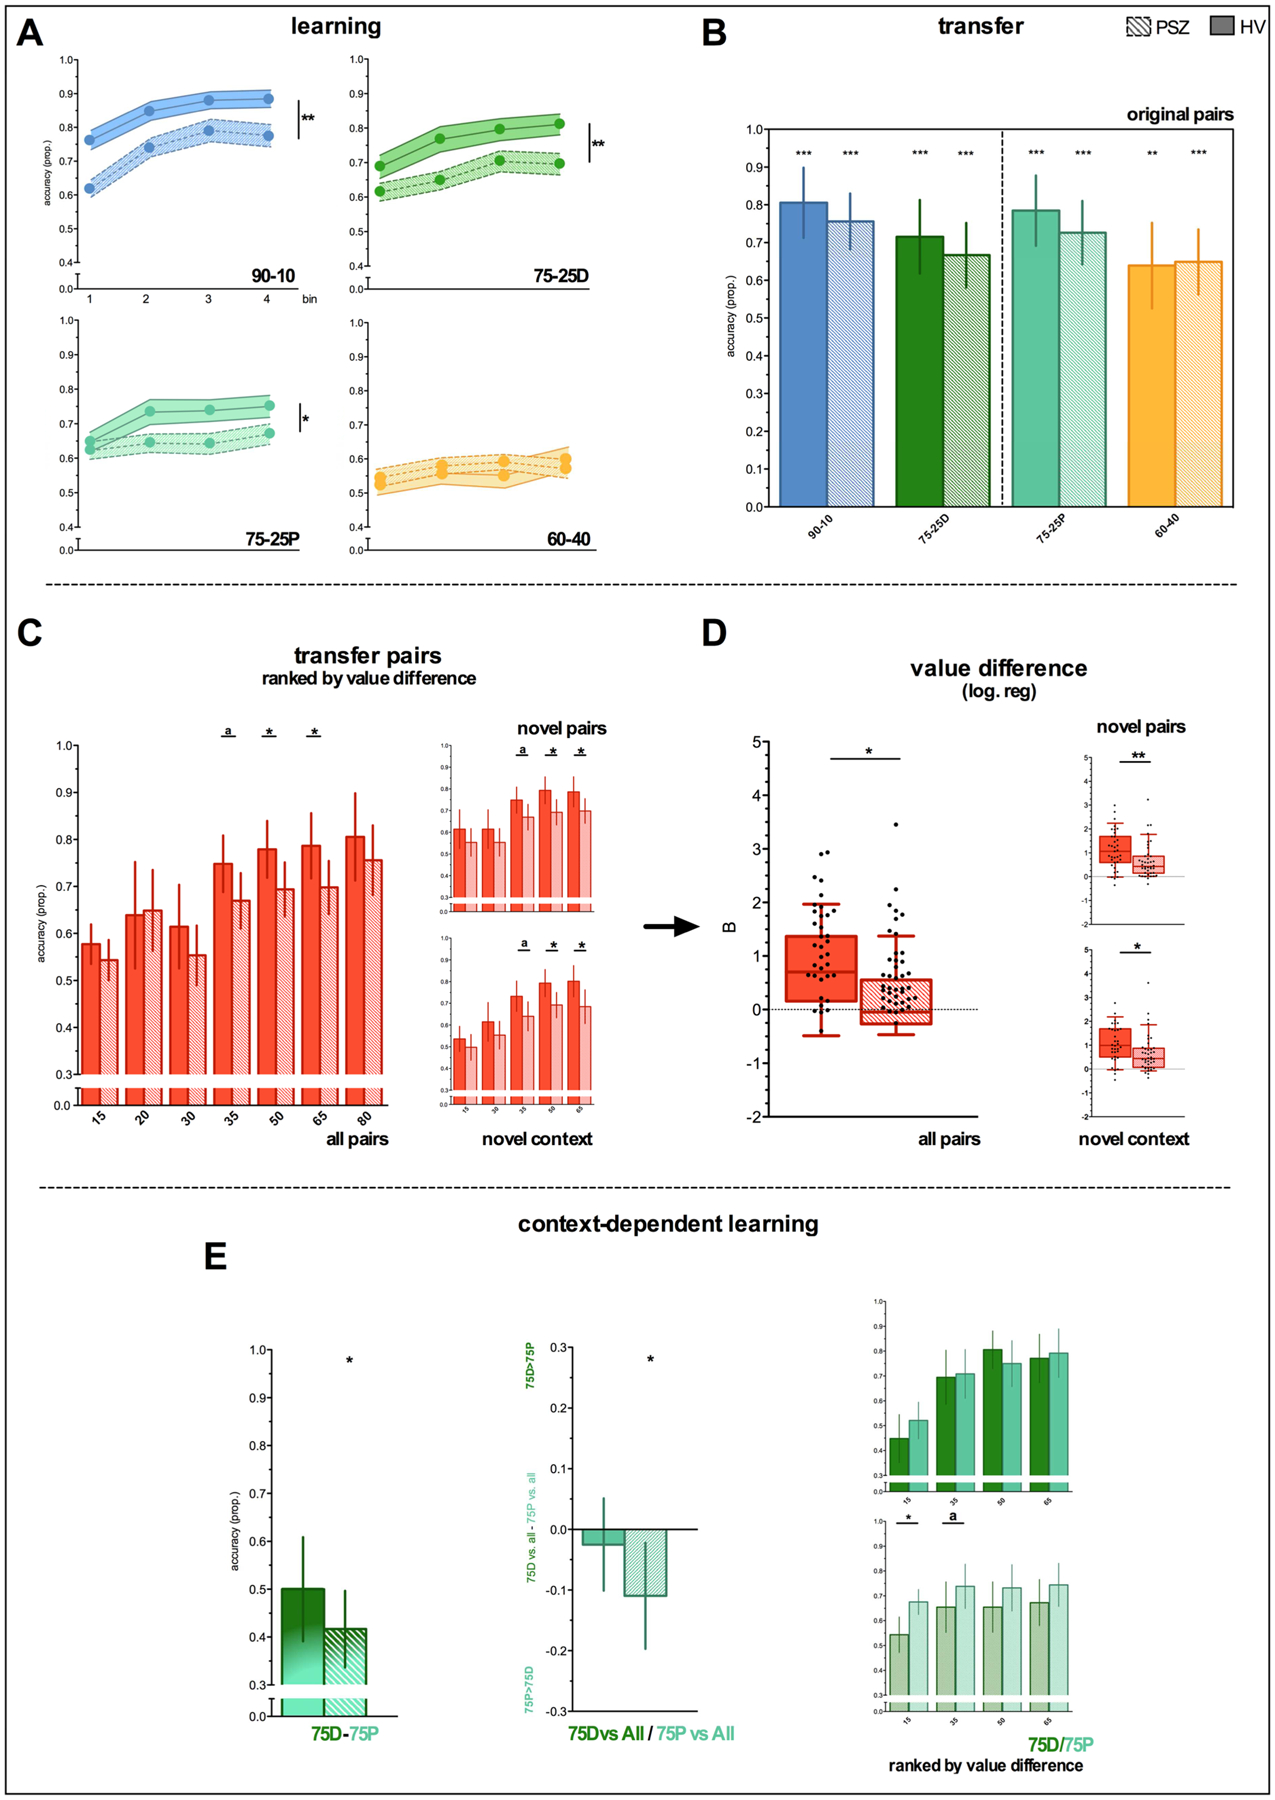
Figure 2. Learning and transfer phase performance.

Solid bars represent HV; bars with diagonal lines represent PSZ. *= p<.05, ** = p<.01, *** = p<.001, a = trend (p = .06–.09). Error bars represent 95% CI, except for learning phase data, where bars represent SEM. Asterisks above error bars represent significant preference against chance; asterisks above solid horizontal line represent between- or within-group differences. Panel E, center: “75D vs. All/75 vs. All” = performance on 75D/P trials versus all choice options of non-identical value. Panel E, right: separate plots for 75D and 75P versus other choice options broken down by their value difference (x-axis).
